Download presentation
Presentation is loading. Please wait.

1
House prices resilience in Paris Christian Tutin, LabUrba/UPEC (email: christian.tutin@u-pec.fr) Governing Metropolitan Regions with a Localist Agenda : London, Paris and Berlin Second Seminar: 22 nd February, 2013 Institut dUrbanisme de Paris, Université de Paris Est Créteil (UPEC)
")
2
Introduction:

3
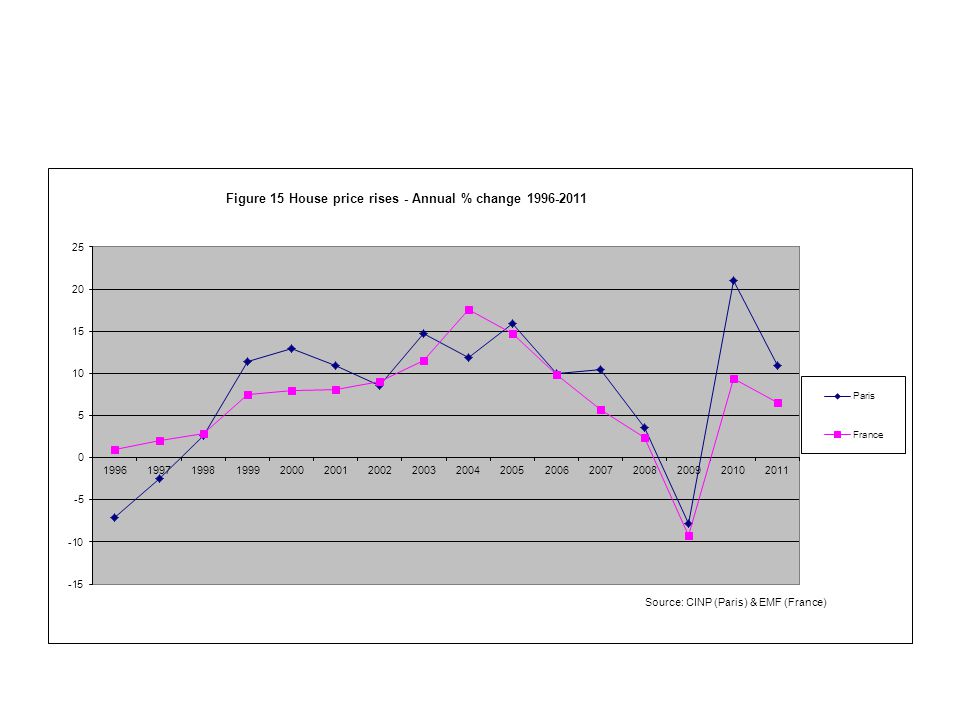
1. What happened to Paris real estate ? 1.1 From buyoancy to resilience

4
Affordability 1 Sharp contrast between slow but continuous rise of wages and the strong and accelerating rise in house prices Not only during the last boom (graph below) But in the long run : 1 sq m of Paris flat = 350 hours of minimal wage in 1984, jumped to 590 in 1990, and 850 hours in 2012.
 But in the long run : 1 sq m of Paris flat = 350 hours of minimal wage in 1984, jumped to 590 in 1990, and 850 hours in 2012.")
5
Affordability 2 Annual Price to Income ratio/1965 value

6
1-2 Specificities of the last price boom Not the mere repetition of the 80s – Not the office market, but the housing market – Not the city core Unprecedented strength and lenght Widespread and uniform

9
1-3 A cumulative disequilibrium dynamics Not specific to Paris (as in the 80s – metropolization process) An extreme case of a more general process (observed at all levels of the urban hierarchy) Consisting in two parallel « waves »: at the bottom of the market : a credit-led boom Credit flooded demand from low income households Historically low interest rates, increased duration of loans
 An extreme case of a more general process (observed at all levels of the urban hierarchy) Consisting in two parallel « waves »: at the bottom of the market : a credit-led boom Credit flooded demand from low income households Historically low interest rates, increased duration of loans")
10
at the top of the market: an asset-led boom Upper middle class groups investing first belt municipalities Price rises made possible for buyers-sellers to buy larger homes (or higher quality) in slightly less valued areas + low interest rates no (or very limited) liquidity constraint for previous home owners (sellers/buyers)
 in slightly less valued areas + low interest rates no (or very limited) liquidity constraint for previous home owners (sellers/buyers)")
12
No « well behaved » demand curve Price-volume correlation: demand not decreasing with prices

13
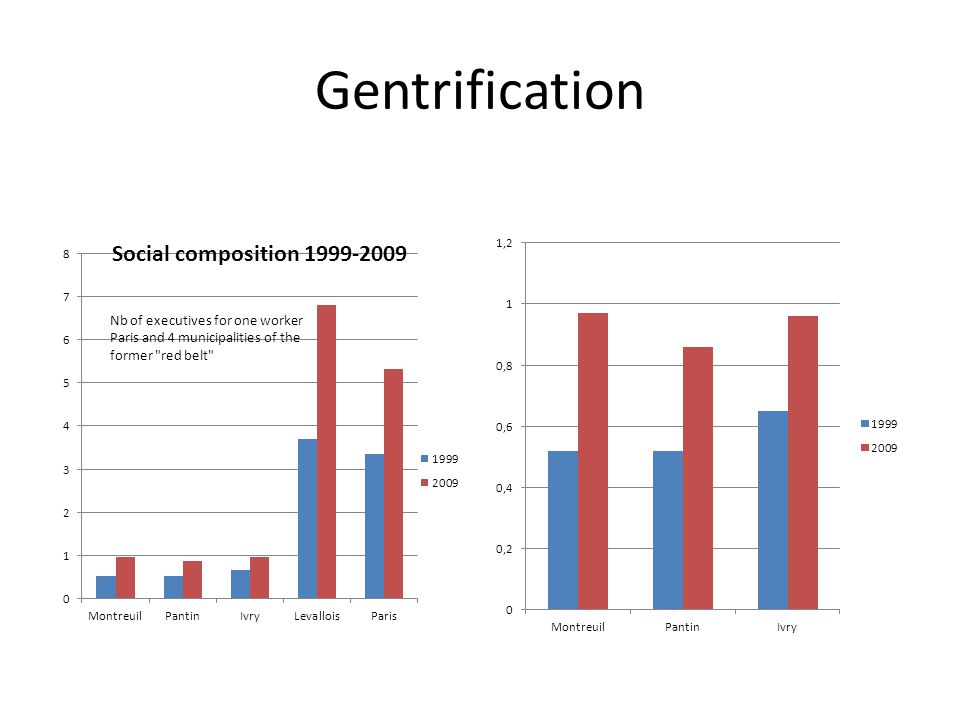
+ Lower middle class groups flight from deprived neighborhoods strong pressure on intermediate residential spaces - While low income households relegated in more and more remote areas urban sprawl + Low construction rates in intermediate spaces quantitative rationing for intermediate income groups increased pressure on existing homes gentrification process in first belt municipalities Intra-urban (spatial content) dimension of the boom
 dimension of the boom")
14
2. The spatial dimension of the market 2.1 The changing geography of house price moves Three periods in the last three decades: 80s and first half of the 90s: the « beaux quartiers » as pilots 1997-2007: first belt municipalities at the forefront ; gentrification of the former working-class suburbs Post financial crisis : back to the 80s ; central Paris resilience – Previous tendancy still at work – More and more asset-led no impact of unemployment And now ? – This time is the end ?

15
2.2 Gentrification

16
Gentrification

18
3 Paris, Berlin and London France and the UK:

19
Paris and London: Londons exceptionnality greater But a common syndroma: non-affordability as the price of inequalities

20
Berlin: Welcome to the club? House price change in Germany % change over a year earlier

22
Thanks for attention

Similar presentations


 Bank of Tokyo-Mitsubishi Ltd.>")


 Luděk Sýkora & Martin Ouředníček Charles University in Prague, Czechia SELMA meeting,>")


