Download presentation
Presentation is loading. Please wait.

1
The Power of Proc Tabulate Part 1: The Basics David M. Rivard

2
Introduction Provides the capability to produce customized professional tables for usage in presentations and reports Syntax based on the Table Producing Language developed by the U.S. Department of Labor Reports summary statistics which are available in Freq, Means, and Summary procedures Handles multiple variables in rows and columns and multiple levels within the rows and columns

3
Series Presentation Outline Proc Tabulate will be presented as a series because the syntax for the procedure may appear complex and intimidating Part 1 Examples of tables produced by the Tabulate and Means procedures Suggested basic steps to begin developing a table General coding format Creating and customizing a simple table

5
Dataset Attributes 428 Records NAME: 2004 New Car and Truck Data TYPE: Sample SIZE: 428 observations, 19 variables DESCRIPTIVE ABSTRACT: Specifications are given for 428 new vehicles for the 2004 year. The variables recorded include price, measurements relating to the size of the vehicle, and fuel efficiency. SOURCE: _Kiplinger's Personal Finance_, December 2003, vol. 57, no. 12, pp. 104-123, http:/www.kiplinger.com

6
Examples of Proc Means proc means data = sasuser.cars; by type; var cyl mpg_city mpg_hwy weight length; run; proc means data = sasuser.cars; class type; var cyl mpg_city mpg_hwy weight length; run;

7
proc means data = sasuser.cars mean; class type doors; by cyl; var mpg_city mpg_hwy weight length; run;

8
proc means data = sasuser.cars mean; class type doors cyl; var mpg_city mpg_hwy weight length; run; What else can I do? Data set had to be resorted by new variables every time a change was made

9
Example of Proc Tabulate By making simple code changes you can slice and dice your table just as you would an EXCEL pivot table. The best part is that SAS does it for you in one procedure verses exporting data to EXCEL and creating the pivot table And how the data is sorted does not matter!

10
How to Begin Determine what statistics to present Sketch a draft of the report Generate the basic code Test, retest, and verify the results using a subset of the data Continue developing the code and creating the table in stages Run the program on the complete data Clean up the final appearance of the table Include ODS Functionality (discussed in the last series)
")
11
General Coding Format PROC TABULATE Data = mydata ; CLASS variables; TABLE page dimension, row dimension, column dimension / RUN;

12
Basic Syntax Rules CLASS: categories (numeric or character) VAR: used in the analysis (numeric) TABLE: constructs the appearance The tables page, row, and column dimensions are separated by commas The asterisk (*) is an operator and specifies: Add another CLASS variable split Include another variable Add a statistic to a variable Designate a format
 VAR: used in the analysis (numeric) TABLE: constructs the appearance The tables page, row, and column dimensions are separated by commas The asterisk (*) is an operator and specifies: Add another CLASS variable split Include another variable Add a statistic to a variable Designate a format")
13
Let Us Begin Cylinders MPG CityMPG HWY Domestic2dr 4dr All Import2dr 4dr All

14
proc tabulate data = sasuser.cars; class type; var mpg_city mpg_hwy; table type, (mpg_city mpg_hwy)*mean; run; proc tabulate data = sasuser.cars; class type; var mpg_city mpg_hwy; table (mpg_city mpg_hwy)*mean; run; proc tabulate data = sasuser.cars; class type cyl; var mpg_city mpg_hwy; table type, (mpg_city mpg_hwy) *cyl *mean; run;
*mean; run; proc tabulate data = sasuser.cars; class type; var mpg_city mpg_hwy; table (mpg_city mpg_hwy)*mean; run; proc tabulate data = sasuser.cars; class type cyl; var mpg_city mpg_hwy; table type, (mpg_city mpg_hwy) *cyl *mean; run;")
15
proc tabulate data = sasuser.cars; class type cyl; var mpg_city mpg_hwy; table type * cyl, (mpg_city mpg_hwy)*mean; run; proc tabulate data = sasuser.cars; class type cyl; var mpg_city mpg_hwy; table type*cyl, (mpg_city mpg_hwy)*mean n='type'; run;
*mean; run; proc tabulate data = sasuser.cars; class type cyl; var mpg_city mpg_hwy; table type*cyl, (mpg_city mpg_hwy)*mean n= type ; run;")
16
proc tabulate data = sasuser.cars; class type cyl; var mpg_city mpg_hwy; table type*(cyl all), (mpg_city mpg_hwy)*mean; run; proc tabulate data = sasuser.cars; class type cyl; var mpg_city mpg_hwy; table (type all)*(cyl all), (mpg_city mpg_hwy)*mean ; run; Proc Tabulate provides flexibility
, (mpg_city mpg_hwy)*mean; run; proc tabulate data = sasuser.cars; class type cyl; var mpg_city mpg_hwy; table (type all)*(cyl all), (mpg_city mpg_hwy)*mean ; run; Proc Tabulate provides flexibility")
17
Remember Our Original Table? Cylinders MPG CityMPG HWY Domestic2dr 4dr All Import2dr 4dr All

18
proc tabulate data = sasuser.cars; class type doors cyl; var mpg_city mpg_hwy; table type*(doors all), cyl*(mpg_city mpg_hwy)*mean ; run;
, cyl*(mpg_city mpg_hwy)*mean ; run;")
19
proc tabulate data = sasuser.cars; class type doors cyl; var mpg_city mpg_hwy; table type='Manufacturer'*(doors='Body Style' all='Overall'), cyl*(mpg_city='City' mpg_hwy='Hwy')*mean=' ' / BOX = 'MPG Analysis'; run; This is okay but let us make it better I should have written Average MPG Analysis
, cyl*(mpg_city= City mpg_hwy= Hwy )*mean= / BOX = MPG Analysis ; run; This is okay but let us make it better I should have written Average MPG Analysis")
20
Now we have a table worth presenting proc tabulate data = sasuser.cars; class type doors cyl; var mpg_city mpg_hwy; table type=' '*(doors=' ' all='Overall'), cyl= ' Engine Cylinders'*(mpg_city='City' mpg_hwy='Hwy')*mean=' ' / BOX = 'MPG Analysis'; run;
, cyl= Engine Cylinders *(mpg_city= City mpg_hwy= Hwy )*mean= / BOX = MPG Analysis ; run;")
21
The Missing Option The data contains variables with missing values Our MPG results would be incorrect if we included on these variables WHY? If an observation contains missing values for any of the variables then that observation is ignored (This was not the case with our sample table since no missing values occurred in the chosen variables) Using the Missing option in the proc statement will tell SAS to include all observations regardless of missing values
 Using the Missing option in the proc statement will tell SAS to include all observations regardless of missing values.")
22
What to Expect Next We have only scratched the surface with PROC TABULATE In the next presentation we will add the following: Formats Percents and percent of sums Other statistics such as min, max, standard deviation, and so on ODS (Output Delivery System) function for stylized tables Inserting logos and pictures
 function for stylized tables Inserting logos and pictures")
23
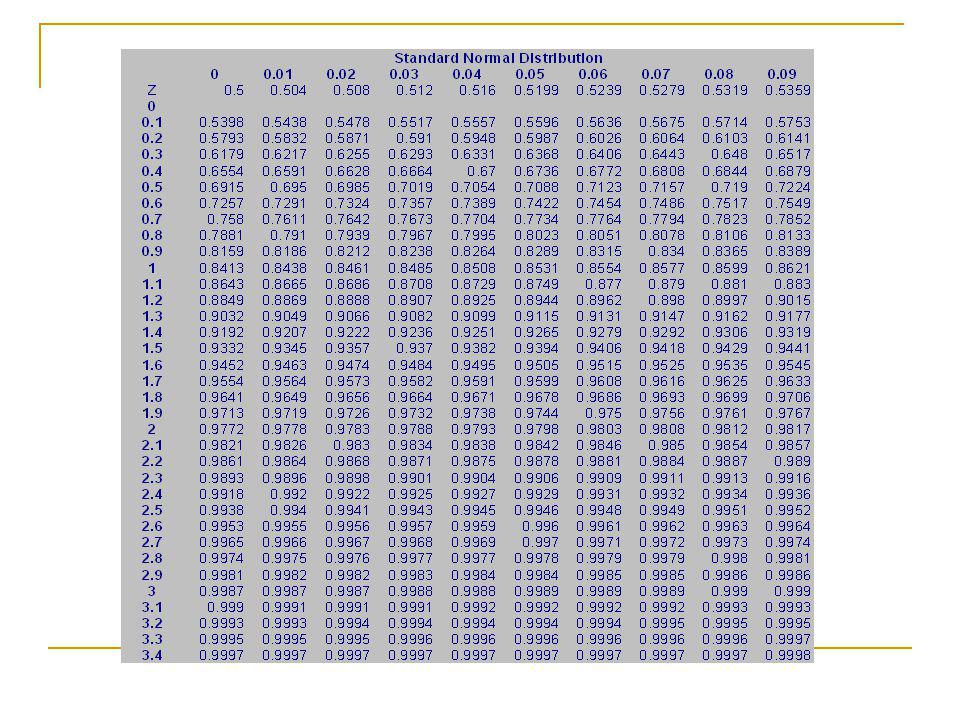
A Bonus for Attending Data guess; do row = 0.0 to 3.4 by 0.1; do column = 0.00 to 0.09 by 0.01; z = row + column; prob = probnorm(z); output; end; run; Proc Tabulate data = guess; class row column; var prob; table row, column*prob=''*sum=''*f=5.4/rtspace=5; label row = 'Z' column = Guess What This Does'; run; Can you guess what the code does?
; output; end; run; Proc Tabulate data = guess; class row column; var prob; table row, column*prob= *sum= *f=5.4/rtspace=5; label row = Z column = Guess What This Does ; run; Can you guess what the code does")
25
What does this code do? data quess; do df=1 to 30 by 1; do prob=0.80, 0.85, 0.90, 0.925, 0.975, 0.99; t=TINV(prob, df); output; end; run; Proc tabulate data = quess; class df prob; var t; table df, prob*t=''*mean=''*f=7.4/rtspace=7 box = 'T'; Label prob = 'Probability'; run;
; output; end; run; Proc tabulate data = quess; class df prob; var t; table df, prob*t= *mean= *f=7.4/rtspace=7 box = T ; Label prob = Probability ; run;.")
27
Resources Park, Hun Myoung Joint Ph.D. student in Public Policy in the Department of Political Science and the School of Public and Environmental Affairs Indiana University. SAS Tabulate http://www.masil.org/sas/tabulate.htmlhttp://www.masil.org/sas/tabulate.html Pass,Ray and Sandy McNeill. Proc Tabulate: Doin It I Style Hawworth, Lauren. Anyone Can Learn PROC TABULATE, v2.0 http://www2.sas.com/proceedings/sugi27/p060- 27.pdfhttp://www2.sas.com/proceedings/sugi27/p060- 27.pdf Why Use Proc Tabulate. http://support.sas.com/publishing/pubcat/chaps/56514.pdfhttp://support.sas.com/publishing/pubcat/chaps/56514.pdf Johnson, Roger W. NAME: 2004 New Car and Truck Data Department of Mathematics and Computer Science South Dakota School of Mines and Technology http://www.amstat.org/publications/jse/jse_data_archive.htmlhttp://www.amstat.org/publications/jse/jse_data_archive.html Jonas V. Bilenas, Making Sense of PROC TABULATE JP Morgan Chase, Wilmington, DE http://www2.sas.com/proceedings/sugi30/243-30.pdf

28
Thank you for attending and happy proc tabulating

Similar presentations


 Animal Science 500 Lecture.>")


