Download presentation
Presentation is loading. Please wait.

2
Unlocking Doors to our Childrens Future BAIRD ISD 2010-2011 BAIRD ISD 2010-2011 Recognized 2008, 2009, 2010 -SMALL TOWN-BIG MINDS- -HUGE HEARTS-

3
KEYS TO UNLOCKING YOUR POTENTIAL BAIRD ISD MISSION STATEMENT As Texas embarks on the 21 st Century, we enter a period of dramatic change in the economic and social conditions of both the state and nation. The educational system of the state is responsible for preparing our children to live and work in this changing future.

4
2009-2010 District Data

5
KEYS TO UNLOCKING YOUR POTENTIAL 2010 Accountability Rating: RECOGNIZED 2008, 2009, 2010 Gold Performance Acknowledgments: Attendance (2008-09) College-Ready Graduates (Class of 2009) Texas Success Initiative (TSI) Mathematics
 College-Ready Graduates (Class of 2009) Texas Success Initiative (TSI) Mathematics")
6
Annual Yearly Progress Indicators Grades 3-8, 10 1)Reading/English Language Arts 2)Mathematics 3)Graduation OR Attendance Rate The performance standard is based on test results for students enrolled for the full academic year. The participation standard is based on participation in the assessment program of all students enrolled on the day of testing.

7
Annual Yearly Progress Indicators Performance Standard: 73% % counted as proficient on test or projected to be proficient based on growth measures for students enrolled the full academic year subject to the federal cap** OR Performance Improvement/Safe Harbor: 10% decrease in percent not proficient on test and meet the standard or meet the improvement requirement for the relevant other measure (Graduation Rate or Attendance Rate) Participation Standard: 95% Participation in the assessment program for students enrolled on the date of testing OR Average Participation Rate: 95% participation based on combined 2008-09 and 2009-10 assessment data Exhibit 1: 2010 AYP Indicators Reading/English Language Arts 2009–10 tests (TAKS, TAKS (Accommodated), TAKS–M, TAKS–Alt, TELPAS Reading*, and LAT in Grades 3–8 & 10) All students and each student group that meets minimum size requirements: African American Hispanic White Economically Disadvantaged Special Education Limited English Proficient
 Participation Standard: 95% Participation in the assessment program for students enrolled on the date of testing OR Average Participation Rate: 95% participation based on combined and assessment data Exhibit 1: 2010 AYP Indicators Reading/English Language Arts 2009–10 tests (TAKS, TAKS (Accommodated), TAKS–M, TAKS–Alt, TELPAS Reading*, and LAT in Grades 3–8 & 10) All students and each student group that meets minimum size requirements: African American Hispanic White Economically Disadvantaged Special Education Limited English Proficient")
8
Annual Yearly Progress Indicators Performance Standard: 67% % counted as proficient on test or projected to be proficient based on growth measures OR for students enrolled the full academic year subject to the federal cap** OR Performance Improvement/Safe Harbor: 10% decrease in percent not proficient on test and meet the standard or meet the improvement requirement for the relevant other measure (Graduation Rate or Attendance Rate) Participation Standard: 95% Participation in the assessment program for students enrolled on the date of testing OR Average Participation Rate: 95% participation based on combined 2008-09 and 2009-10 assessment data Exhibit 1: 2010 AYP Indicators Mathematics 2009–10 tests (TAKS, TAKS (Accommodated),TAKS–M, TAKS–Alt, and LAT in Grades 3–8 & 10) All students and each student group that meets minimum size requirements (see above)
 Participation Standard: 95% Participation in the assessment program for students enrolled on the date of testing OR Average Participation Rate: 95% participation based on combined and assessment data Exhibit 1: 2010 AYP Indicators Mathematics 2009–10 tests (TAKS, TAKS (Accommodated),TAKS–M, TAKS–Alt, and LAT in Grades 3–8 & 10) All students and each student group that meets minimum size requirements (see above)")
9
Annual Yearly Progress Indicators 4-yr Graduation Rate Goal: 90.0% or 4-yr Graduation Rate Target: 75.0 or Safe harbor graduation rate Target*** or Improvement of 1.0 % or more or 5-yr Graduation Rate Target: 80.0% Graduation Rate for high schools, combined elementary/secondary schools offering Grade 12 and districts offering Grade 12 Attendance Rate Standard: 90.0% or any improvement Attendance Rate for elementary schools, middle/junior high schools, combined elementary/secondary schools not offering Grade 12, and districts not offering Grade 12 Exhibit 1: 2010 AYP Indicators Other Indicator**** All students Graduation Rate Class of 2009 (4-year rate) Class of 2008 (5-year rate) Attendance Rate 2008–09
 Class of 2008 (5-year rate) Attendance Rate 2008–09")
11
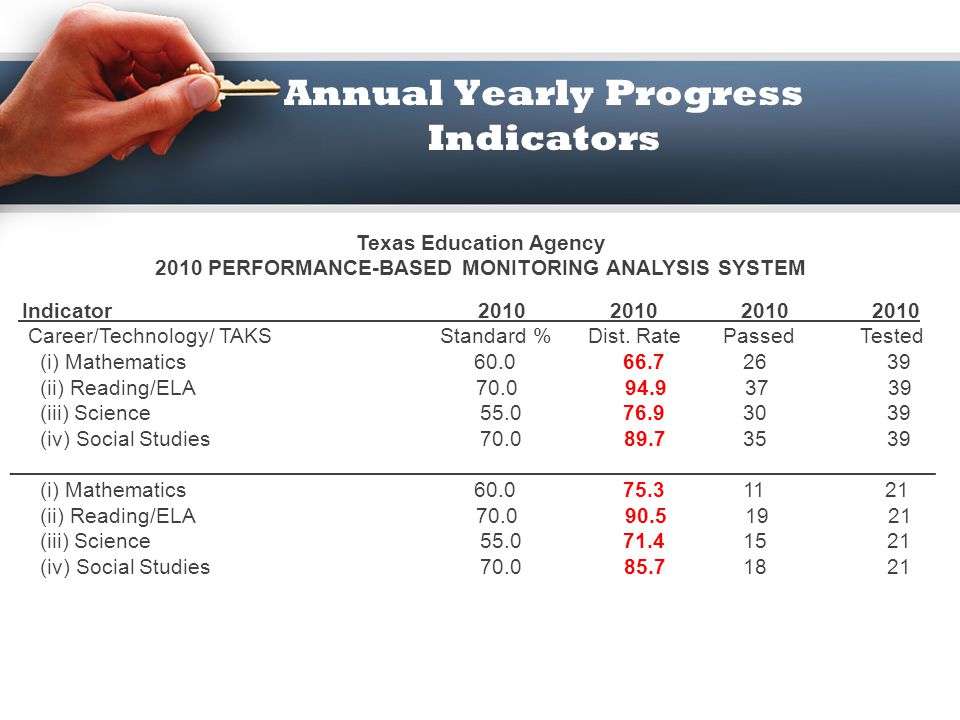
Annual Yearly Progress Indicators Texas Education Agency 2010 PERFORMANCE-BASED MONITORING ANALYSIS SYSTEM Indicator 2010 2010 2010 2010 Career/Technology/ TAKS Standard % Dist. Rate Passed Tested (i) Mathematics 60.0 66.7 26 39 (ii) Reading/ELA 70.0 94.9 37 39 (iii) Science 55.0 76.9 30 39 (iv) Social Studies 70.0 89.7 35 39 ______________________________________________________________________________ (i) Mathematics 60.0 75.3 11 21 (ii) Reading/ELA 70.0 90.5 19 21 (iii) Science 55.0 71.4 15 21 (iv) Social Studies 70.0 85.7 18 21
 Mathematics (ii) Reading/ELA (iii) Science (iv) Social Studies ______________________________________________________________________________ (i) Mathematics (ii) Reading/ELA (iii) Science (iv) Social Studies")
12
Annual Yearly Progress Indicators Texas Education Agency 2010 PERFORMANCE-BASED MONITORING ANALYSIS SYSTEM (2) Indicator 2010 2010 2010 2010 Career/Technology/ TAKS SP ED Standard % Dist. Rate Passed Tested (i) Mathematics 60.0 25.0 2 8 (ii) Reading/ELA 70.0 75.0 6 8 (iii) Science 55.0 50.0 4 8 (iv) Social Studies 70.0 62.5/57.1/83.3 5 8 ______________________________________________________________________________ CTE TECH PREP TAKS (i) Mathematics 60.0 66.7 20 30 (ii) Reading/ELA 70.0 93.3 28 30 (iii) Science 55.0 80.0 24 30 (iv) Social Studies 70.0 90.0 27 30
 Mathematics (ii) Reading/ELA (iii) Science (iv) Social Studies /57.1/ ______________________________________________________________________________ CTE TECH PREP TAKS (i) Mathematics (ii) Reading/ELA (iii) Science (iv) Social Studies")
13
Annual Yearly Progress Indicators Texas Education Agency 2010 PERFORMANCE-BASED MONITORING ANALYSIS SYSTEM (2) Indicator 2010 2010 2010 2010 Title I, Part A TAKS / (ACCOM.) Standard % Dist. Rate Passed Tested (i) Mathematics 60.0 73.0 46 63 (ii) Reading/ELA 70.0 75.0 54 63 (iii) Science 55.0 88.9 16 18 (v) Writing 70.0 80.0 16 20 ______________________________________________________________________________ Sp ED TAKS TALS(ACCOM.) (i) Mathematics 60.0 38.1 8 21 (ii) Reading/ELA 70.0 71.4 15 21 (iii) Science 55.0 50.0 5 10 (v) Writing 70.0 100.0 1 1
 Mathematics (ii) Reading/ELA (iii) Science (v) Writing ______________________________________________________________________________ Sp ED TAKS TALS(ACCOM.) (i) Mathematics (ii) Reading/ELA (iii) Science (v) Writing")
14
Academic Excellence Indicator System (AEIS) 2010 DefinitionTAKS/ TAKS (ACCOM) COMP. Rate I DROP OUT RATE STANDARDS Exemplary:..... All Subjects.. 90% Recognized:.... All Subjects.. 80% Acceptable:.. Read/ELA/Writ/Soc St. 70% Mathematics........................ 60% Science............................... 55% EX: 95.0% RE: 85.0% AA: 75.0% EX: 1.8% RE: 1.8% AA: 1.8% Subjects Reading/ELA............ gr. 3-11 Writing........................ gr. 4, 7 Mathematics............. gr. 3-11 Social Studies..... gr. 8, 10, 11 Science........... gr. 5, 8, 10, 11

15
Academic Excellence Indicator System (AEIS) 2010 Required Improvement Actual Change2010 – 2009 performance Required ImprovementGain needed to reach standard in 2 years UseAs a gate up to Academically Acceptable or Recognized Floor> 75% for Recognized, no floor for Academically Acceptable Texas Projection Measure Estimate of whether a student is likely to pass a TAKS test in a future grade. % passing w/ TPM includes those projected to pass as passers. UseAs a gate to Acceptable, Recognized, or Exemplary

16
Academic Excellence Indicator System (AEIS) 2010 (2008-2009) Subject Texas Success Initiative (TSI) Acknowledged # Met Standard # Taking Test% Met Std All Students212488% Hispanic44100% White172085% Econ Dis.91275%
 2010 ( ) Subject Texas Success Initiative (TSI) Acknowledged # Met Standard # Taking Test% Met Std All Students212488% Hispanic44100% White172085% Econ Dis.91275%")
17
Academic Excellence Indicator System (AEIS) 2010 (2008-2009) Subject Recommended High School Program (RHSP) / Distinguished Achievement Program (DAP) Acknowledged 2008- 2009 # Met Standard # Taking Test% Met Std All Students242692.3% Hispanic11100% White232592% Econ Dis.12 100%
 2010 ( ) Subject Recommended High School Program (RHSP) / Distinguished Achievement Program (DAP) Acknowledged # Met Standard # Taking Test% Met Std All Students % Hispanic11100% White232592% Econ Dis %")
18
Academic Excellence Indicator System (AEIS) 2010 Subject Reading / ELA # Met Standard # Taking Test% Met Std% Met W/ TPM All Students166 (35)19% CP 18689%95% Hispanic36 (7) 17% CP 4188%95% White130 (25)19% CP 14590%95% Econ Disadv.102 (15) 15% CP 12085%93% At-RISK85% 7% CP 92% Special Ed TAKS -M 71% 5% CP 83% CP 90%
 2010 Subject Reading / ELA # Met Standard # Taking Test% Met Std% Met W/ TPM All Students166 (35)19% CP 18689%95% Hispanic36 (7) 17% CP 4188%95% White130 (25)19% CP 14590%95% Econ Disadv.102 (15) 15% CP 12085%93% At-RISK85% 7% CP 92% Special Ed TAKS -M 71% 5% CP 83% CP 90%")
19
Academic Excellence Indicator System (AEIS) 2010 Subject Writing # Met Standard # Taking Test% Met Std% Met W/ TPM All Students38 (12) 29% CP 4290%100% Hispanic6 (1) 13% CP 875%100% White32 (11) 34% CP 3494%100% Econ Dis.24 (8) 29% CP 2886%100% At-RISK70%99% Special Ed**%
 2010 Subject Writing # Met Standard # Taking Test% Met Std% Met W/ TPM All Students38 (12) 29% CP 4290%100% Hispanic6 (1) 13% CP 875%100% White32 (11) 34% CP 3494%100% Econ Dis.24 (8) 29% CP 2886%100% At-RISK70%99% Special Ed**%")
20
Academic Excellence Indicator System (AEIS) 2010 Subject Social Studies # Met Standard # Taking Test% Met Std% Met W/ TPM All Students61 (12) 18% CP 6692%98% Hispanic11 (4) 33% CP 1292% White50 (8) 15% CP 5493%100% Econ Dis36 (4) 10% CP 4090%98% At-RISK93%97% Special Ed70%99%
 2010 Subject Social Studies # Met Standard # Taking Test% Met Std% Met W/ TPM All Students61 (12) 18% CP 6692%98% Hispanic11 (4) 33% CP 1292% White50 (8) 15% CP 5493%100% Econ Dis36 (4) 10% CP 4090%98% At-RISK93%97% Special Ed70%99%")
21
Academic Excellence Indicator System (AEIS) 2010 Subject Mathematics # Met Standard # Taking Test% Met Std% Met W/ TPM All Students141 (28) 15% CP 18676%87% Hispanic29 (5) 12% CP 4171%85% White112 (23) 16% CP 14577%88% Econ Dis83 (13) 11% CP 12069%83% At-RISK60% TAKS-M 99% 79% Special Ed38% TAKS-M 99% 57%
 2010 Subject Mathematics # Met Standard # Taking Test% Met Std% Met W/ TPM All Students141 (28) 15% CP 18676%87% Hispanic29 (5) 12% CP 4171%85% White112 (23) 16% CP 14577%88% Econ Dis83 (13) 11% CP 12069%83% At-RISK60% TAKS-M 99% 79% Special Ed38% TAKS-M 99% 57%")
22
Academic Excellence Indicator System (AEIS) 2010 Subject Science # Met Standard # Taking Test% Met Std% Met W/ TPM All Students68 (14) 17% CP 8481%90% Hispanic12 (3) 19% CP 1675%88% White56 (11) 16% CP 6882%91% Econ Dis.44 (10) 18% CP 5679%88% At-RISK72%92% Special Ed50%70%
 2010 Subject Science # Met Standard # Taking Test% Met Std% Met W/ TPM All Students68 (14) 17% CP 8481%90% Hispanic12 (3) 19% CP 1675%88% White56 (11) 16% CP 6882%91% Econ Dis.44 (10) 18% CP 5679%88% At-RISK72%92% Special Ed50%70%")
23
District Goals 1) BISD will offer more curriculum opportunities for the students –Innovative opportunities –More dual credit courses –Explore distance learning opportunities –Higher order thinking curriculum- problem solving/critical thinking 2) BISD will become one of the BEST small schools with an Exemplary rating
 BISD will offer more curriculum opportunities for the students –Innovative opportunities –More dual credit courses –Explore distance learning opportunities –Higher order thinking curriculum- problem solving/critical thinking 2) BISD will become one of the BEST small schools with an Exemplary rating")
24
3) BISD faculty will be committed to the district –Children of faculty members attend BISD 4) BISD will practice positive marketing of its student successes and faculty and staff. 5) BISD will build and maintain a general fund that maintains a three month operating balance. 6) BISD will develop a rotation system to maintain a fleet of dependable buses.
 BISD will build and maintain a general fund that maintains a three month operating balance. 6) BISD will develop a rotation system to maintain a fleet of dependable buses..")
25
New or revised Board Goals: 7-7-2010 -Aggressively continue and increase the college and dual credit program. -Work to develop harmony within the district - Positive image within the school and community -Survey parents of students that transfer out of the district. - Develop an updated facility plan. - Study the tax rate each year- I&S and M&O.

26
NEW ITEMS TO MEET DISTRICT GOALS Technology: 1)District Web Site- Updated to increase information to the community. 2)Lightspeed Server- To improve research capabilities 3)Computer lab – Increase after school hours 4)Movie Licensing- To protect from Copyright infringement 5)SchoolTipline – Web based Bully reporting service 6)New Phone System- To replace aging system
Lightspeed Server- To improve research capabilities 3)Computer lab – Increase after school hours 4)Movie Licensing- To protect from Copyright infringement 5)SchoolTipline – Web based Bully reporting service 6)New Phone System- To replace aging system.")
27
NEW ITEMS TO MEET DISTRICT GOALS Curricular: 1)Adobe 6 Software - for CTE class. 2)ALEKS – Mathematics support (web based) 3)Optional Flexible School Year – Assist at-risk students in identified core areas 4)High School Career Fair- Increase information to students 5)Library- Funds were increased this year to purchase updated books. 6)Calculators- 84 calculators purchased to assist Math 7)Promethean Boards - in Core classrooms
ALEKS – Mathematics support (web based) 3)Optional Flexible School Year – Assist at-risk students in identified core areas 4)High School Career Fair- Increase information to students 5)Library- Funds were increased this year to purchase updated books. 6)Calculators- 84 calculators purchased to assist Math 7)Promethean Boards - in Core classrooms.")
28
NEW ITEMS TO MEET DISTRICT GOALS Facilities / Transportation / Personnel: 1) Purchase a van or SUV 2) Develop a long range facility plan 3) Personal District Days – Increased from 4 to 5 days. Employee may accrue up to 20 days Employee may opt to sell back days each year

Similar presentations


 Grants Chapter 6.>")


 U.S. Department of Education Adapted by TEA September 2003.>")
