Download presentation
Presentation is loading. Please wait.

1
Ming Mao, Jie Li, Marty Humphrey eScience Group CS Department, University of Virginia Grid 2010 – Oct 27, 2010

2
A fast growing computing platform IDC - Cloud spending increases 27.4% a year to $56 billion (compared 5% a year of traditional IT) $16.5 billion (2009) -> $55.5 billion (2014) src: Worldwide and Regional Public IT Cloud Service 2010-2014 Forecast Two most quoted benefits Scalable computing and storage Reduced cost Concerns Security, availability, cost management, integration interoperability, etc.
 $16.5 billion (2009) -> $55.5 billion (2014) src: Worldwide and Regional Public IT Cloud Service Forecast Two most quoted benefits Scalable computing and storage Reduced cost Concerns Security, availability, cost management, integration interoperability, etc.")
3
Q1. Cost – the most important factor in practice? Q2. Moving into Cloud == Reduced Cost ?

4
Resource utilization information based triggers (e.g. AWS auto-scaling, RightScale, enStratus, Scalr, etc)
.")
5
Multiple instance types Current billing models Full hour billing Non-ignorable instance acquisition time 7-15 min in Windows Azure More specific performance goals Budget awareness (e.g. dollars/month, dollars/job)
.")
6
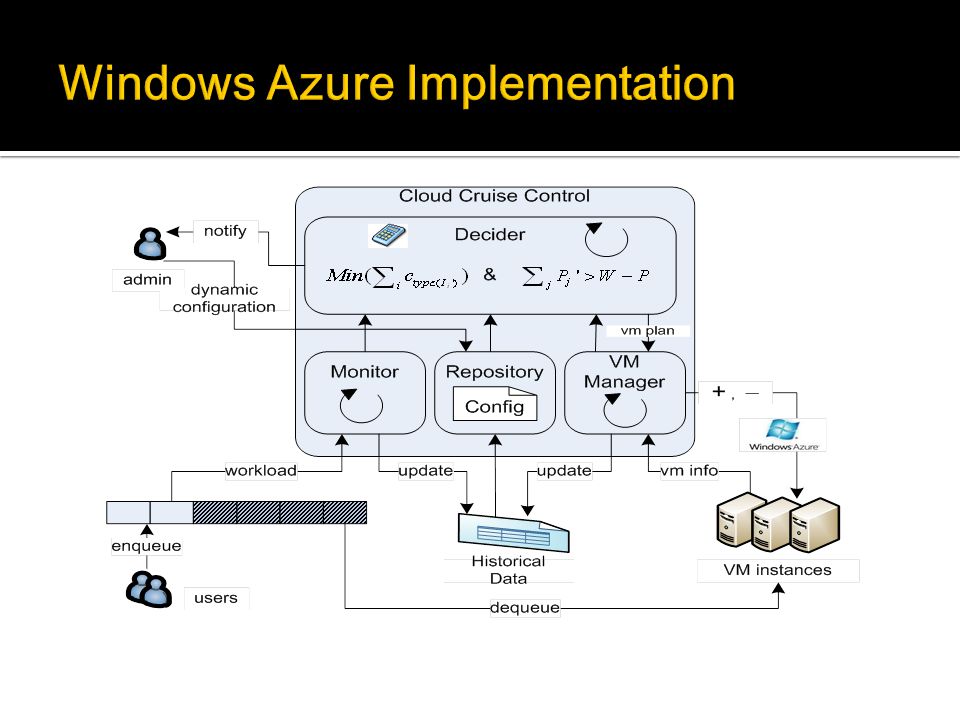
Deadline (Job finish time) Cost Problem Statement – how to enable cloud applications to finish all the submitted jobs before user specified deadline with as little money as possible using auto-scaling.
 Cost Problem Statement – how to enable cloud applications to finish all the submitted jobs before user specified deadline with as little money as possible using auto-scaling.")
7
Workload are non-dependent jobs submitted in the job queue FCFS manner and fairly distributed Different classes of jobs Same performance goal (e.g.1 hour deadline) VM instances take time to startup
 VM instances take time to startup")
8
Key variables used in the model

9
Workload Computing Power of Instance Running Instance Pending Instance

10
Scale up Sufficient budget Insufficient budget Scale down

11
WorkloadRequired Computing Power where

13
Mix Avg 30 jobs/hour STD 5 jobs/hour Computing Intensive Avg 30 jobs/hour STD 5 jobs/hour IO Intensive Avg 30 jobs/hour STD 5 jobs/hour General 0.085$/hour Delay 600s Average 300s STD 50s Average 300s STD 50s Average 300s STD 50s High-CPU 0.17$/hour Delay 720s Average 210s STD 25s Average 75s STD 15s Average 300s STD 50s High-IO 0.17$/hour Delay 720s Average 210s STD 25s Average 300s STD 50s Average 75s STD 15s Workload & VM simulation parameters

16
VM TypesTotal Cost ($) % more than optimal Choice #1General98.52$ (43%) Choice #2High-CPU128.86$ (87%) Choice #3High-IO129.71$ (88%) Choice #4General, High-CPU, High-IO78.62$ (14%) OptimalGeneral, High-CPU, High-IO68.85$
 % more than optimal Choice #1General98.52$ (43%) Choice #2High-CPU128.86$ (87%) Choice #3High-IO129.71$ (88%) Choice #4General, High-CPU, High-IO78.62$ (14%) OptimalGeneral, High-CPU, High-IO68.85$")
17
MODIS 200X – Year Terra & Aqua – Satellite (X - Y) – Day X to day Y 15 images / day Moderate scale test (up to 20 instances) Large Scale test (up to 90 instances) * C.H. – computing hour 1C.H. = 0.12$ in Windows Azure 1hour deadline2hour deadline3hour deadline Terra 2004(10-12) Total 45 jobs 4 C.H.* or 0.48$ 18 min late8 min early20 min early 9 C.H.or 1.08$6 C.H or 0.72$5 C.H.or 0.6$ Aqua 2008(30-32) Total 45 jobs 4 C.H. or 0.48$ 15min late20 min early29 min early 10 C.H or 1.2$7 C.H.or 0.84$5 C.H.or 0.6$ 2 hour deadline4 hour deadline Terra & Aqua 2006(1-75) Total 1125 jobs 93 C.H. or 11.16$ 20min late 170 C.H. or 20.4$ 6 min early 132 C.H. or 15.84$ Terra & Aqua 2006(1-150) Total 2250 jobs 185 C.H. or 22.2$ Admission Denied22 min early 243 C.H. or 29.16$
 Total 45 jobs 4 C.H.* or 0.48$ 18 min late8 min early20 min early 9 C.H.or 1.08$6 C.H or 0.72$5 C.H.or 0.6$ Aqua 2008(30-32) Total 45 jobs 4 C.H. or 0.48$ 15min late20 min early29 min early 10 C.H or 1.2$7 C.H.or 0.84$5 C.H.or 0.6$ 2 hour deadline4 hour deadline Terra & Aqua 2006(1-75) Total 1125 jobs 93 C.H. or 11.16$ 20min late 170 C.H. or 20.4$ 6 min early 132 C.H. or 15.84$ Terra & Aqua 2006(1-150) Total 2250 jobs 185 C.H. or 22.2$ Admission Denied22 min early 243 C.H. or 29.16$.")
18
Test: Terra & Aqua 2006(1-75) - total 1125 jobs 6min early theoretical cost - 93 C.H. or 11.16$ actual cost - 132 C.H. or 15.84$

19
Conclusions More cost-efficient than fixed-size instance choice VM startup delay can affect hugely in practice Future works More general cloud application model Multiple job classes Consider other instance types (e.g. spot instances & reserved instances) Data transfer performance and storage cost
 Data transfer performance and storage cost.")
Similar presentations


>")

>")

