Download presentation
Presentation is loading. Please wait.

1
PRT WORK SESSION PRESENTATION By: Dao Mi and Matthew Douglas

2
Project Guide Lines Construct a PRT network throughout County. Use Shape Points to direct guide ways around obstacles Use Interchanges to facilitate faster transit from station to station. Attain a Profitable Network that services 90% of trips in county.

3
Grid-Like Structure

4
Use of Shape Points

5
Interchanges to Shorten Trip Length

6
Sussex County Founded June 8, 1753 Population(2000): 153,384 Density: 276.7/sq mi Area Total: 536 sq mi Land: 521 sq mi
: 153,384 Density: 276.7/sq mi Area Total: 536 sq mi Land: 521 sq mi")
7
Sussex County Final PRT Network

8
Sussex Network Statistics Trip TypeHomeWorkSchoolRecreationPTTotal Trip Ends Served 313,932 52,242 62,942 3,541 108,395 541,052 Possible 576,664 67,917 71,290 3,618 126,418 845,907 Percent Trip Ends Served 54.4%76.9%88.3%97.9%85.7%64.0%

9
Sussex Financial Statistics Financial Networks Statistics; County Sussex Stations Interchang es Miles of Guideway Length Total Trip ends servedTotal Trips Peak hour TripsFleet size Average trip Length Average Vehicle OccupancyFare Vehicle Operating Costs (#) (miles)(per day) (#)(Miles) (Trips/vehicl e) 222109338.3 541,052 216,355 32,4531,78552 $3.26 $0.20 Basic Costs, Revenue; County Sussex Capital CostsAnnual Recurring CostsAnnual Revenue P&L StationsGuidewayVehiclesTotal Cost of Capital Maintenan ceOperatingTotalFare Station lease and naming rightsTotal (M$) $444 $1,692 $178 $2,314 $139 $46 $32 $218 $212 $8 $220 $2.01
 (miles)(per day) (#)(Miles) (Trips/vehicl e) , ,355 32,4531,78552 $3.26 $0.20 Basic Costs, Revenue; County Sussex Capital CostsAnnual Recurring CostsAnnual Revenue P&L StationsGuidewayVehiclesTotal Cost of Capital Maintenan ceOperatingTotalFare Station lease and naming rightsTotal (M$) $444 $1,692 $178 $2,314 $139 $46 $32 $218 $212 $8 $220 $2.01")
11
Warren County Founded November 20, 1824 Population(2000): 102,437 Density: 287/sq mi Area Total : 363 sq mi Land : 358 sq mi
: 102,437 Density: 287/sq mi Area Total : 363 sq mi Land : 358 sq mi")
12
Warren County Final PRT Network

13
Warren Network Statistics Trip TypeHomeWorkSchoolRecreationPTTotal Trip Ends Served 156,760 52,344 42,960 10,000 23,108 285,172 Possible 410,636 85,191 55,992 10,000 31,214 588,033 Percent Trip Ends Served38.2%61.4%76.7%100.0%74.0%48.5%

14
Warren Financial Statistics Financial Networks Statistics; County Warren Stations Interchang es Miles of Guideway Length Total Trip ends servedTotal Trips Peak hour TripsFleet size Average trip Length Average Vehicle OccupancyFare Vehicle Operating Costs (#) (miles)(per day) (#)(Miles) (Trips/vehicl e) 99102250.91 285,172 98,876 14,83181652 $3.00 $0.20 Basic Costs, Revenue; County Warren Capital CostsAnnual Recurring CostsAnnual Revenue P&L StationsGuidewayVehiclesTotal Cost of Capital Maintenan ceOperatingTotalFare Station lease and naming rightsTotal (M$) $198 $1,255 $82 $1,534 $92 $31 $15 $138 $89 $4 $93 $(45)
 (miles)(per day) (#)(Miles) (Trips/vehicl e) ,172 98,876 14, $3.00 $0.20 Basic Costs, Revenue; County Warren Capital CostsAnnual Recurring CostsAnnual Revenue P&L StationsGuidewayVehiclesTotal Cost of Capital Maintenan ceOperatingTotalFare Station lease and naming rightsTotal (M$) $198 $1,255 $82 $1,534 $92 $31 $15 $138 $89 $4 $93 $(45)")
16
Hunterdon County Founded 1714 Population(2000): 121,989 Density: 285/sq mi Area Total: 438 sq mi Land: 430 sq mi
: 121,989 Density: 285/sq mi Area Total: 438 sq mi Land: 430 sq mi")
17
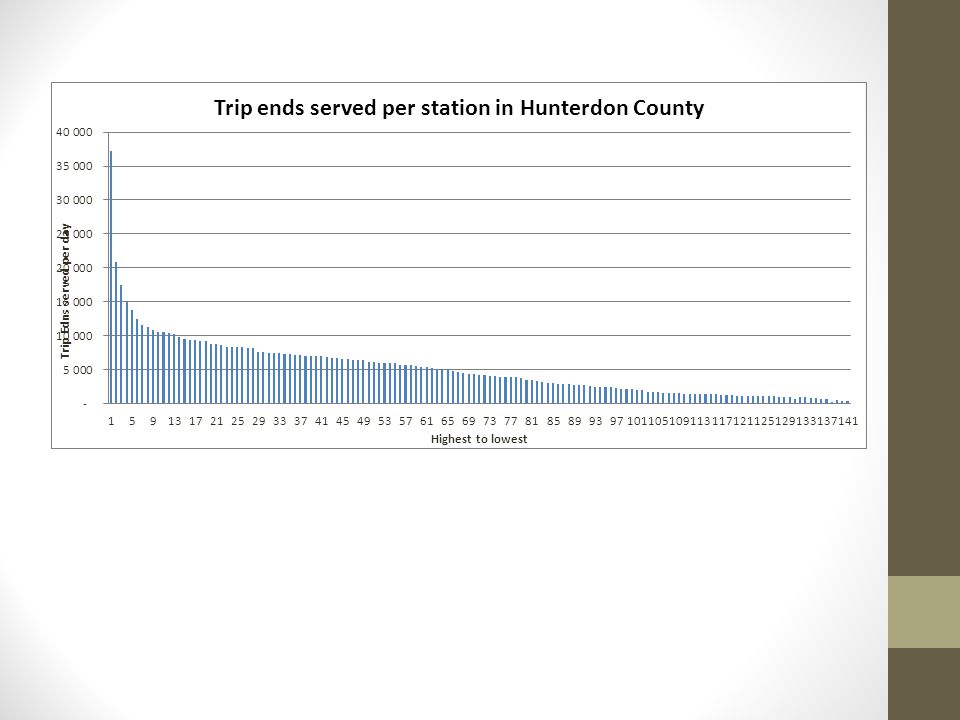
Hunterdon Final PRT Network

18
Hunterdon Financial Statistics (work in progress) Networks Statistics; County Hunterdon Stations Interchang es Miles of Guideway Length Total Trip ends servedToal Trips Peak hour TripsFleet size Average trip Length Average Vehicle OccupancyFare Vehicle Operating Costs (#) (miles)(per day) (#)(Miles) (Trips/vehic le) 14479290.14 723,204 327,174 49,0762,69952 $2.10 $0.20 Basic Costs, Revenue; County Sussex Capital CostsAnnual Recurring CostsAnnual RevenueP&L StationsGuidewayVehiclesTotal Cost of Capital Maintenan ceOperatingTotalFare Station lease and naming rightsTotal (M$) $288 $1,451 $270 $2,009 $121 $40 $49 $210 $206 $5 $211 $1.54
 Networks Statistics; County Hunterdon Stations Interchang es Miles of Guideway Length Total Trip ends servedToal Trips Peak hour TripsFleet size Average trip Length Average Vehicle OccupancyFare Vehicle Operating Costs (#) (miles)(per day) (#)(Miles) (Trips/vehic le) , ,174 49,0762,69952 $2.10 $0.20 Basic Costs, Revenue; County Sussex Capital CostsAnnual Recurring CostsAnnual RevenueP&L StationsGuidewayVehiclesTotal Cost of Capital Maintenan ceOperatingTotalFare Station lease and naming rightsTotal (M$) $288 $1,451 $270 $2,009 $121 $40 $49 $210 $206 $5 $211 $1.54")
19
Hunterdon Network Statistics (work in progress) Trip TypeHomeWorkSchoolRecreationPTTotal Trip Ends Served 461,228 75,708 9,000 940 176,328 723,204 Possible 505,412 108,363 9,600 1,474 258,568 883,417 Percent Trip Ends Served91.3%69.9%93.8%63.8%68.2%81.9%
 Trip TypeHomeWorkSchoolRecreationPTTotal Trip Ends Served 461,228 75,708 9, , ,204 Possible 505, ,363 9,600 1, , ,417 Percent Trip Ends Served91.3%69.9%93.8%63.8%68.2%81.9%")
21
Combined Network Combined Stats: Population: 377 810 Land: 1309 sq miles Density: 288.62/sq mi PRT Network Guideways: 930.8 mi Fleet: 4403 Stations: 473 Interchanges: 306

22
PRT Ridership Trip Typehomeschoolworkshoppingtransportationentertainmen t/etc Total Trip Ends Served 938,963 193,640 108,762 6,718 4,872 317,047 1,570,002 Possible 1,492,712 261,471 127,282 6,718 5,092 416,200 2,309,475 Percent Trip Ends Served 62.9%74.1%85.4%100.0%95.7%76.2%68.0%

23
Trip Density

24
Combined PRT Network Networks Statistics; County Hunterdon StationsInterchanges Miles of Guideway Length Total Trip ends servedToal Trips Peak hour TripsFleet size Average trip Length Average Vehicle OccupancyFare Vehicle Operating Costs (#) (miles)(per day) (#)(Miles) (Trips/vehic le) 473306930.81,570,002533,65180,0484403523.41 $0.20
 (miles)(per day) (#)(Miles) (Trips/vehic le) ,570,002533,65180, $0.20")
25
Network Financials

Similar presentations


 Al 2 S 3 b) MgO 3.NaF = 4.0 – 0.9 = 3.1: ionic, London. H 2 O = 3.5 – 2.1 = 1.4: dipole-dipole.>")


