Download presentation
Presentation is loading. Please wait.

1
Trisha Muñoz, E.I.T Civil Engineering Department Cal Poly Pomona

2
General safety background Description of the research method and crash data Illustration of the results Discussion and Conclusions

4
Pictures from: www.nhtsa.com and www.images.google.comwww.nhtsa.com www.images.google.com

6
Statistics (2005 – NHTSA Traffic Safety Facts) Fatal 43,443 Injury 2,699,000 Property Damage Only4,304,000 Traffic Crash Victims Killed Injured Occupants Drivers 26,549 1,920,000 Passengers 11,199 880,000 Unknown 112 Nonmotorists Pedestrians4,808 71,000 Pedalcyclists 662 48,000 Other/Unknown 113 7,000 7,046,443 }
 Fatal 43,443 Injury 2,699,000 Property Damage Only4,304,000 Traffic Crash Victims Killed Injured Occupants Drivers 26,549 1,920,000 Passengers 11, ,000 Unknown 112 Nonmotorists Pedestrians4,808 71,000 Pedalcyclists ,000 Other/Unknown 113 7,000 7,046,443 }")
7
Impaired driving is often a symptom of a larger problem: alcohol misuse and abuse. Alcohol-impaired motor vehicle crashes cost more than an estimated $37 billion annually. In 2010, more than 10,000 people died in alcohol-impaired driving crashes - one every 51 minutes. Sources: http://www.nhtsa.gov/Impaired

8
Numerous Past research studies : driving performance is seriously impaired by alcohol and many other drugs. However, very few research studies: identifying the effects of alcohol and other drugs on traffic accident types rear-end head on sideswipe fixed object others

10
Normally distributed errors (i.e., residues) Constant variance of errors No relationships among the independent variables (i.e., regressor variables, or predictors)
 Constant variance of errors No relationships among the independent variables (i.e., regressor variables, or predictors)")
11
The dependent variable y has categorical nature (i.e., various accident types), which is not normally distributed Therefore, the Normal Linear Regression is not appropriate herein. Instead, we use Multinomial Logit Regression Model.

13
Road Sections from State Routes 77 and 83 in Tucson, AZ Total mileage: 83 miles Crash period: 6 years (Oct. 2003~ Sept. 2008) Information: crash, driver, vehicle, environment, roadway, etc.
 Information: crash, driver, vehicle, environment, roadway, etc..")
14
Date & time Day of week Crash location Crash severity ( No Injury; Possible Injury; Non-incapacitating; Incapacitating; Fatal; unknown) Collision type (rear-end, head-on, collision with fixed objects, etc.) Hit-and-run (yes, no)
 Collision type (rear-end, head-on, collision with fixed objects, etc.) Hit-and-run (yes, no)")
15
Sex Age Conditions influencing drivers (use of illicit drugs; physical impairment, illness, etc.) Violations (speed; made improper turn; ran stop sign, etc.) ……
 Violations (speed; made improper turn; ran stop sign, etc.) ……")
16
Number of vehicles Vehicle condition: (No apparent defects; defective brakes; defective steering, etc.) Vehicle type: (passenger cars, school bus, RVs, pick up trucks, etc.) Vehicle action: (making left-turn, making U-turn, changing lanes, backing, etc.)
 Vehicle type: (passenger cars, school bus, RVs, pick up trucks, etc.) Vehicle action: (making left-turn, making U-turn, changing lanes, backing, etc.)")
17
Pavement material: ( concrete, asphalt, other) Surface condition: (dry, wet, sand, ice, etc.) Roadway defects Roadway alignment-horizontal Roadway alignment-vertical Unusual roadway condition (no unusual conditions, under repair, under construction-traffic detoured, etc.) Roadway characteristic (2-way striped median; 2-way painted median; 2-way raised median, etc.)
 Surface condition: (dry, wet, sand, ice, etc.) Roadway defects Roadway alignment-horizontal Roadway alignment-vertical Unusual roadway condition (no unusual conditions, under repair, under construction-traffic detoured, etc.) Roadway characteristic (2-way striped median; 2-way painted median; 2-way raised median, etc.)")
18
Location classification (recreational, farm, business, school, etc.) Weather conditions (clear, not clear) Light conditions (Daylight, others) Traffic level (light, heavy& medium) Speed limit
 Weather conditions (clear, not clear) Light conditions (Daylight, others) Traffic level (light, heavy& medium) Speed limit")
20
To improve modeling accuracy, 3 models were estimated separately for various accident types single vehicle car colliding with car car colliding with trucks. For the categorical accident types, level 1 (others) is used as the reference level. For the categorical driver physical conditions, level 1( others and unknown) is used as the reference level.
 is used as the reference level. For the categorical driver physical conditions, level 1( others and unknown) is used as the reference level..")
21
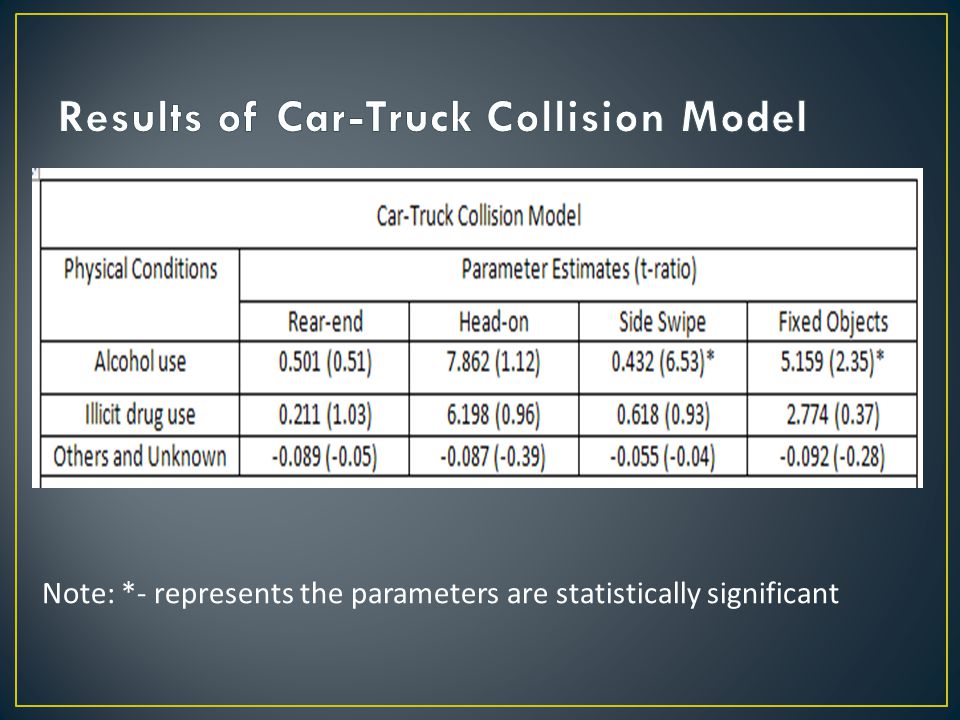
Note: *- represents the parameters are statistically significant

24
For all the three types of models (single vehicles, car-car collision, and car-truck collision), the use of alcohol significantly affects the accident types. However, the use of illicit drug and other physical conditions has not shown an apparent influence to the types. Since the research study uses only the accident data from the State of Arizona, the study findings need further confirmation.

25
General safety background Description of the research method and crash data Illustration of the results Discussion

Similar presentations


 Population Motor vehicles.>")
