Download presentation
Presentation is loading. Please wait.

1
Relationship between Genotype and Phenotype
Molecular Basis for Relationship between Genotype and Phenotype genotype DNA DNA sequence transcription RNA translation amino acid sequence protein function phenotype organism

2
Tissue-specific Regulation of Transcription
Regulated transcription depends on: - specific enhancer for gene(s) - enhancer-specific activator proteins - correct interaction between enhancer and activator Tissue-specific regulation requires that the enhancer-specific activator is present only in cells of that tissue type. ectopic expression: expression in an abnormal location
 - enhancer-specific activator proteins. - correct interaction between enhancer and activator. Tissue-specific regulation requires that the enhancer-specific activator is present only in cells of that tissue type. ectopic expression: expression in an abnormal location.")
3
“Master Switch” Gene Eye formation requires over 2000 genes. eyeless (ey) mutation causes small rudimentary eyes to form in Drosophila melanogaster. Small eyes (Sey, Pax-6) in mouse causes similar phenotype. Aniridia gene in human (lack of normal iris) shows considerable homology to ey gene.
 in mouse causes similar phenotype. Aniridia gene in human (lack of normal iris) shows considerable homology to ey gene.")
4
Comparison of ey+ and ey Phenotypes
Wild-type eyes eyeless (ey) eyes size of ey eyes
 eyes. size of ey eyes.")
5
eyeless (ey) gene codes for a helix-turn-helix transcription protein.
“Master Switch” Gene Wild-type eyeless (ey) gene can be induced to be expressed ectopically. eyeless (ey) gene codes for a helix-turn-helix transcription protein.
 gene can be induced to be expressed ectopically. eyeless (ey) gene codes for a helix-turn-helix transcription protein.")
6
Enhanceosomes and Synergistic Effect on Transcription
Enhanceosome: protein complex of trans-acting factors bound to appropriate DNA sequences. Proteins interact synergistically to elevate transcription rate. In b-interferon gene transcription, TFs recruit a coactivator (CBP) which is needed for transcription to occur normally. Formation of the enhanceosome and activation of RNA polymerase by coactivator are necessary for efficient transcription. Transcription of b-interferon gene is activated during viral infection.
 which is needed for transcription to occur normally. Formation of the enhanceosome and activation of RNA polymerase by coactivator are necessary for efficient transcription. Transcription of b-interferon gene is activated during viral infection.")
7
Relationship between Genotype and Phenotype
Molecular Basis for Relationship between Genotype and Phenotype genotype DNA DNA sequence transcription RNA translation amino acid sequence protein function phenotype organism

8
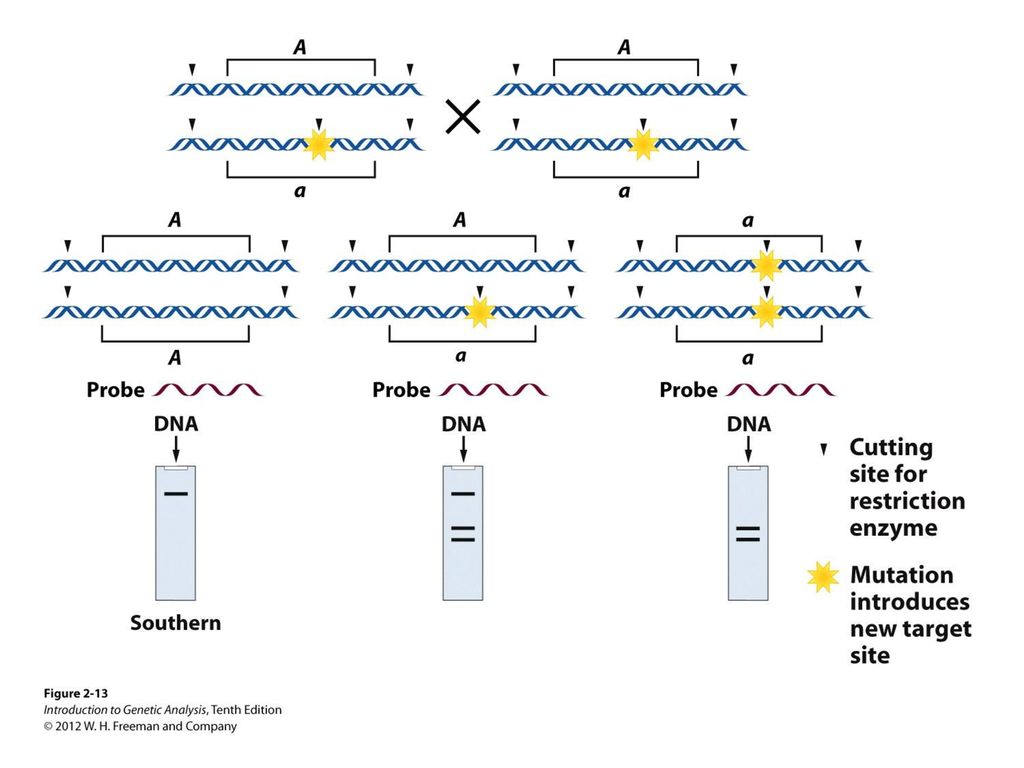
Restriction Mapping DNA is restriction digested with restriction enzymes, individually (single-enzyme digest) and in combination (double digest). The restriction fragments are subjected to electrophoresis. The fragments are identified, either using UV absorbing dye or labeled probe. Double digest determines if fragment produced by one enzyme contains restriction sites for the other enzyme. Fragments are aligned by size. Enzyme 1: 8 kb, 6 kb, 3 kb or 3 kb, 6 kb, 8 kb 6 kb, 8 kb, 3 kb or 3 kb, 8 kb, 6 kb 8 kb, 3 kb, 6 kb or 6 kb, 3 kb, 8 kb Enzyme 2: 10 kb, 7 kb or 7 kb, 10 kb Double Digest: 3 kb fragment is split into 2 kb and 1 kb fragments.

10
Restriction Fragment Length Polymorphism (RFLP)
Individuals can be identified according to RFLP genotype. RFLP locus could be linked to a gene, and thus be used as a diagnostic marker.

11
Use of Restriction Fragment Length Polymorphism
I. Marker locus II. Diagnostic A. Medicine B. Forensics III. Assessment of Genetic Variation A. Within and between populations B. Within and between species

12
Restriction Mapping versus RFLP Mapping
I. Restriction Mapping A. Based on physical analysis of DNA B. Based on restriction sites with no variation C. Mostly short-range (fine-scale) maps II. RFLP Mapping A. Based on recombination analysis of matings B. Based on restriction-site variation between homologous chromosomes C. Mostly longe-range (coarse-scale) maps
 maps. II. RFLP Mapping. A. Based on recombination analysis of matings. B. Based on restriction-site variation between homologous chromosomes. C. Mostly longe-range (coarse-scale) maps.")
13
Other Useful Approaches
1. Single Nucleotide Polymorphisms (SNPs) Individuals differ in single nucleotides (every 11 to 300 bp in interval). Simple-Sequence Length Polymorphisms (SSLPs) Very short repetitive DNA sequences are more polymorphic than RFLP sequences. These are also called Variable Number Tandem Repeats (VNTRs) - Minisatellite Markers - Microsatellite Markers
 Individuals differ in single nucleotides (every 11 to 300 bp in interval). Simple-Sequence Length Polymorphisms (SSLPs) Very short repetitive DNA sequences are more polymorphic than RFLP sequences. These are also called Variable Number Tandem Repeats (VNTRs) - Minisatellite Markers. - Microsatellite Markers.")
14
Simple-Sequence Length Polymorphisms
1. Minisatellite DNA These are 1 to 5 kb in length consisting of repeats 15 to 100 nucleotides in length and are identified by Southern analysis. Microsatellite DNA These are tandem repeats of dinucleotides, commonly stretches of CA. These are identified by gel electrophoresis of PCR products. 5’ C A C A C A C A C A C A C A 3’ 3’ G T G T G T G T G T G T G T 5’

15
Refer to Figure 4-15, Griffiths et al., 2015.

Similar presentations
 Molecular Medicine 2) Energy sources and environmental applications 3) Risk assessment 4) Bioarchaeology,>")


 Analysis of DNA (Sequencing) Chemical Synthesis.>")
>")
>")
 By Amr S. Moustafa, M.D.; Ph.D. Assistant Prof. & Consultant, Medical Biochemistry Dept. College of.>")


.>")

