Download presentation
Presentation is loading. Please wait.

1
Infrared Imaging and Spectroscopic Phenomenology of the Turin Shroud
Joseph S. Accetta, Ph.D. Georgia Tech Research Institute Georgia Institute of Technology Atlanta, GA This paper discusses the infrared imaging and spectroscopy experiments conducted in 1978 by the STRP team. It also discusses the 3-d effect and its interpretation and lastly we show spectroscopic data on various substances on linen that would constitute a data base for future studies.

2
Outline Introduction and theory Review of the 1978 Results
Spectroscopy Thermal Infrared Spectroscopy of Various Image Formation Theories Future Possibilities Conclusions This is an outline of the talk

3
Objectives of the 1978 Infrared Experiments
Investigate on a “first look” basis the IR imagery of the cloth Are the image attributes in the LWIR consistent with the visible image What are the characteristics of the LWIR emissivity Determine the chemical composition or the presence of certain chemical groups via IR reflectance spectroscopy in the MWIR and LWIR on the Shroud To affirm or deny certain informed speculations on the image formation processes To confirm the presence of other materials What we were attempting to establish in the 1978 Infrared Imaging tests was that there was an IR image that was reasonably consistent with the image in the visible region of the spectrum. We noted that the brighter regions of the IR imagery corresponded to the darker regions of the IR image and so the result was consistent with the original contention that IR emissivity should be proportional to image density. Secondly we wanted to confirm that there was no artifact that was apparent in the IR imagery that was not in the visible image. We found none. The second major objective was to measure the spectral reflectance of various features on the cloth to see if the results were consistent with know chemical compounds. This was a high risk -high payoff experiment. It was extremely difficult to do with the equipment at hand under the circumstances we operated in. Technically speaking single beam spectroscopy is known to be challenging in the laboratory much less in the environment we were operating in.

4
Infrared Imaging Summary
IR imaging attempted in 3-5um and 8-14 um bands. No images observed in either band without illumination. With external illumination (dual 1500 watt photolamps) no image observed in the 3-5 um With external illumination, considerable detail observed in the 8-14um band. Most visible features were observed in IR with greater or lesser degrees of fidelity. No significant new information revealed To observe an image in the long wave infrared LWIR (8-14um) it was necessary to illuminate the Shroud with high intensity photo lamps. The visible energy of the lamps was converted to heat in proportion to the absorptivity of the image and reradiated in the IR region of the spectrum. Actually this was an 11th hour result that was achieved only in Turin. We had been unable to do this in previous attempts so we were quite surprised. The experiment revealed no significantly new information other than the absorptivity in the visible regions of the spectrum track the emissivity in the long wave region rather well and that there appeared to be no artifact in the IR that was not apparent in the visible region of the spectrum
 no image observed in the 3-5 um. With external illumination, considerable detail observed in the 8-14um band. Most visible features were observed in IR with greater or lesser degrees of fidelity. No significant new information revealed. To observe an image in the long wave infrared LWIR (8-14um) it was necessary to illuminate the Shroud with high intensity photo lamps. The visible energy of the lamps was converted to heat in proportion to the absorptivity of the image and reradiated in the IR region of the spectrum. Actually this was an 11th hour result that was achieved only in Turin. We had been unable to do this in previous attempts so we were quite surprised. The experiment revealed no significantly new information other than the absorptivity in the visible regions of the spectrum track the emissivity in the long wave region rather well and that there appeared to be no artifact in the IR that was not apparent in the visible region of the spectrum.")
5
Thermal Infrared Imagery
Visible Images This slide shows some of the LWIR images that were collected at different camera settings and contrasted with several versions of the visible images. We see that the imagery is quite similar making due note of the fact that the resolution of the long wave camera is much poorer than the high quality photographic cameras used to create the visible imagery. 8-14 μm, range 1.75°C, Sensitivity ~ .1°C Δε ~ 2%

6
Long Wave IR (LWIR) Phenomenology
All bodies radiate energy. Bodies at room temperature conveniently radiate around 10um in the LWIR In the LWIR, 2 factors are responsible for image contrast, temperature and emissivity: E = εσT4 Emissivity is the property that is equivalent to radiative efficiency and in an imaging context roughly equivalent to image density or reflectivity. Differences in emissivity can be attributed to material/chemical changes or surface properties This chart explains the physics behind the IR imagery.

7
Comparison of Visible and Thermal Infrared Imagery
Charcoal Drawing and Simulated IR Image IR Image of a Classical Oil Painting This chart compares images of the same object in both infrared and visible regions of the spectrum. It can be said that IR imagery in these long wave bands resembles a “heat” picture where brighter regions correspond to slightly higher temperatures. The contrast is particularly startling when looking at the human body where the imagery is rendered by the temperature differences not by the color of the skin. We note that in conventional paintings some things can be seen in the IR that cannot be seen in the visible…sometimes an underlying painting can be seen that was covered up by the artist and a new painting created on the same canvas. Human Body Thermal Infrared Images Outdoor Natural Scene

8
Analysis of IR Imagery Crude correlation between visible image density and infrared emissivity - not always the case Explanations for Observed Contrast: Changes in emissivity Changes in the density of fibers of a given emissivity (fibers/mm2) similar to halftone process Combination of the two Both produce same visual/infrared effect and may exhibit the so called 3d property (maybe an unintended consequence). The specific mechanism may have a significant impact on theorizing possible image formation processes Contrast Process This chart explains two possible origins of IR contrast. A progressively stronger chemical reaction say that gives rise to darker images or a an increasing number of colored fibers of the same density as in a halftone process. According to Rodgers, the Shroud appears to be the latter. Halftone Process
 similar to halftone process. Combination of the two. Both produce same visual/infrared effect and may exhibit the so called 3d property (maybe an unintended consequence). The specific mechanism may have a significant impact on theorizing possible image formation processes. Contrast Process. This chart explains two possible origins of IR contrast. A progressively stronger chemical reaction say that gives rise to darker images or a an increasing number of colored fibers of the same density as in a halftone process. According to Rodgers, the Shroud appears to be the latter. Halftone Process.")
9
Image Recognition Attributes (artistic license taken with all)
Shape Lighting- Color and Direction The Reflectance Distribution (BRDF) Most surfaces will yield apparent contrast depending on their orientation with respect to the observer and the lighting direction Shadows Necessary ingredient in realistic images-difficult to create photographic images without some shadowing, leads to distortion in a 3-d representation of conventional imagery Color Relative Contrast Perspective How do artists create 2 dimensional images that create not only beautiful imagery but emotional reactions in the observer? These techniques are the tools of artistic interpretation.
 Most surfaces will yield apparent contrast depending on their orientation with respect to the observer and the lighting direction. Shadows. Necessary ingredient in realistic images-difficult to create photographic images without some shadowing, leads to distortion in a 3-d representation of conventional imagery. Color. Relative Contrast. Perspective. How do artists create 2 dimensional images that create not only beautiful imagery but emotional reactions in the observer These techniques are the tools of artistic interpretation.")
10
The 3-d Nature of the Image
The 3-d nature of the cloth is revealing. The 3-d fidelity of the image implies little artistic bent. All of the shadowing and other attributes of a conventional interpretation are missing. Equivalent to the creation of an image devoid of shadows and directional lighting only containing the spatial reflectance distribution characteristic. Concave surface dark in normal presentation There is much to be said about the so-called 3-d image properties of the Shroud; so much so that the author is writing a paper on the subject. One of the first things noticable about the Shroud image is the lack of interpretive mechanisms and the stark character of the image. It appears that the image was created under very special conditions. A pseudo 3-d property implies that the image is devoid of shadows and that requires unusual lighting. Further that the artist interpose himself between the light source and somehow “paint” the image in the negative with perfect proportional contrast. This set of circumstances is so unusual that it is easy to conclude that there was no “artist” directly involved in the image formation process is compelling. We have to look for another explanation. Light Source Convex surface light in normal presentation In the Shroud these presentations are reversed

11
3-D Property This is a series of ‘death mask’ images almost all of which exhibit some shadowing thus with the possible exception of the left most image most would exhibit some distortion in isometric 3-d projection. The point is that it is difficult to generate images with this property. Further that the properties of the film used to record the images has to be examined before any conclusion is drawn. Shadowing is apparent in all of these images except perhaps the leftmost one. None of the other images would render a 3-d reproduction with a vp-8 or similar instrument.

12
Conclusions Interpretation of the 3-d effect not trivial. MTF and film linearity are factors. IR image displays roughly the same features as the visible image Speculate that the IR image would exhibit pseudo 3-d properties as well Maybe little more than an artifact of the image formation process In conclusion, the IR images as expected seem to display the pseudo 3-d effect but as shown previously the 3-d effect has to be examined closely before any conclusions can be drawn..

13
Spectroscopic Investigations
Offers both destructive and non-destructive means for identification of the chemistry associated with the various features including: Spectra of the base cloth. Characteristic linen features plus contamination Image areas Scorch areas Blood areas All are amenable to qualitative analysis via spectroscopy IR Spectroscopy is generally the laboratory tool of choice for determining chemical composition non-destructively. In a non-destructive testing regimen where the sample can’t be brought to the machine such as the 1978 investigation, the technique proved to be especially difficult. Furthermore, due to a computer failure the data collected during this experiment was not good and no conclusions were possible with respect to chemical composition of the various feature areas on the Shroud.

14
Identification of Chemical Compounds and Groups
Characteristic Bond Frequencies Appeal to Spectral Libraries This chart shows how the observed spectral lines relate to the chemical bonds and even the specific chemical compounds that might be present.

15
Phenomenology of a Remote Spectroscopic Measurement
Blackbody Illumination Source Spectrometer Atmospheric Absorption Background Radiation E λ This chart shows the experimental configuration used in the IR spectroscopy experiment. The atmosphere plays a role in the data collection and has to be accounted. Because of the computer failure correction was difficult. We couldn’t collect the data fast enough to avoid atmospheric effects.

16
1978 Results Equipment failures resulted in very poor statistical sampling of reflectance spectra in both bands (3-5um and 8-14um) Atmospherics played a part in the results Large uncertainty in spectral noise precluded more definitive analysis Re-analysis attempted This a summary of the IR Spectroscopy experiment.

17
Spectral Reflectance of Linen
The next series of charts show laboratory spectra of the various feature of the Shroud that might have been collected if everything worked correctly.

18
Linen Cotton Spectral Comparison 400-4000cm-1
This represents a first look at the problem of distinguishing linen from cotton and have attached the gross comparison. Consistent with the literature, in general the spectra are nearly indistinguishable in the region cm-1 at least within the limits of my instrument. The linen spectra is in blue. I also note that it doesn’t neither resemble the LANL FTIR data.

19
Spectral Reflectance of Linen vs Cellulose

20
Cellulose

23
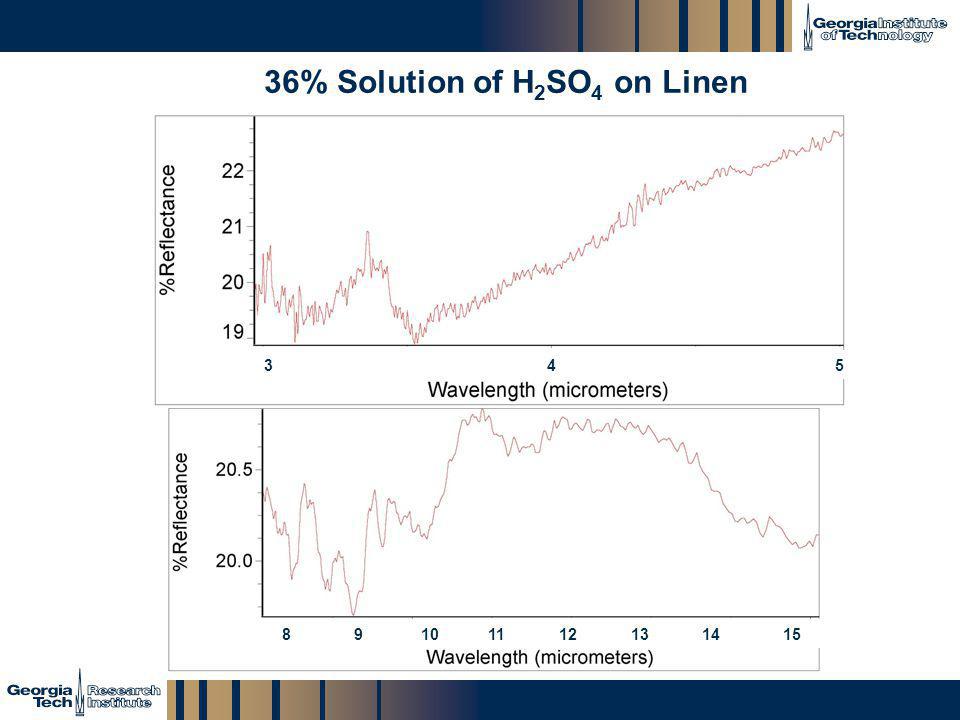
36% Solution of H2SO4 on Linen
24
Whole Blood on Linen

25
Lemon Juice on Linen

26
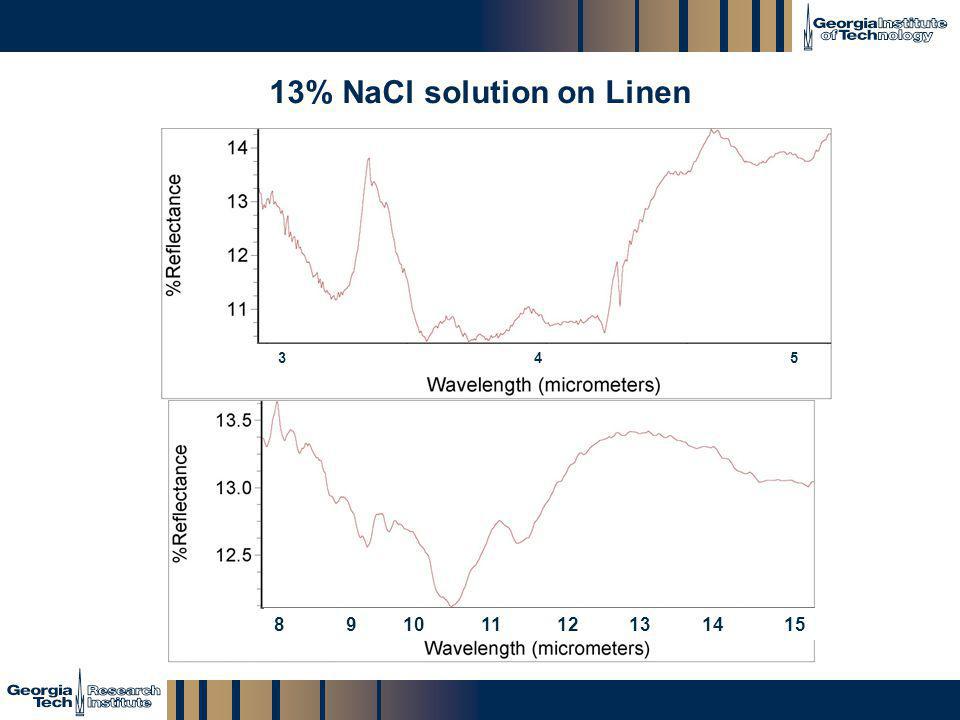
13% NaCl solution on Linen
27
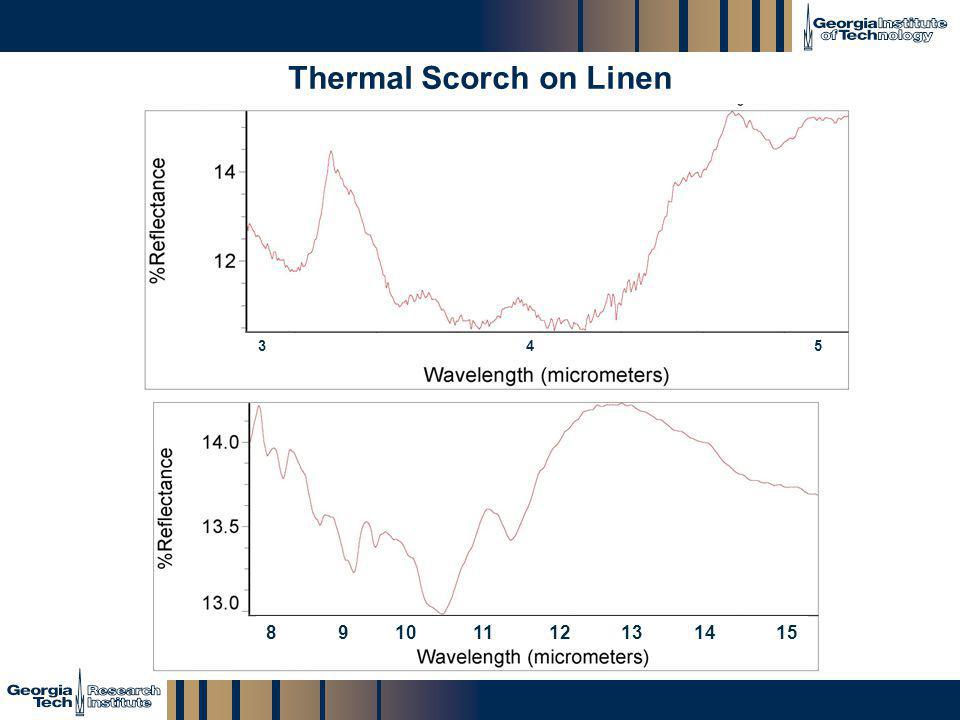
Thermal Scorch on Linen
28
New Possibilities Spectroscopic instrumentation now exists to determine the bonds if not the chemical composition of image features Destructively-probably Non-destructively-possibly Recommend a research program to examine the bounds of spectroscopic non-destructive testing on a microscopic or macroscopic level. Much has changed since the 1978 investigation in the way of instrumentation and techniques. If the experiment were to be done again today, much better results would be possible.

Similar presentations


>")


