Download presentation
Presentation is loading. Please wait.

1
Probing microscopic magnetic dots and their periodic arrays with ferromagnetic resonance G.N. Kakazei Institute of Materials Science of Madrid, CSIC Institute of Magnetism National Academy of Sciences of Ukraine, Kiev Tim Mewes MINT/Department of Physics and Astronomy, University of Alabama, USA Phil Wigen Department of Physics, Ohio State University, Columbus, USA

2
Ferromagnetic Resonance H 0 µ H rf natural response driven response Precession and relaxation of M in response to an applied field H. Lorentzian absorption line typical of FMR showing microwave power absorption as a function of swept bias field. ω = 2πf = γB

3
Ferromagnetic resonance spectrometer X-band : 9-10 GHz K-band : 24-25 GHz Q-band 34-36 GHz

4
Calculation of the angular dependence for thin film 1 st : Zeeman;2 nd : demagnetization energy 3 rd : out-of-plane anisotropy4 th : in-plane uniaxial anisotropy If in-plane uniaxial anisotropy is absent or negligible y x z z MsMs H θ1θ1 θHθH From this equation we can find equilibrium θ can be found for each particular H

5
g =2.2 M s (from SQUID)=1.3 10 3 emu/cm 3 K u =-4.3 10 5 erg/cm 3 easy plane type
= emu/cm 3 K u = erg/cm 3 easy plane type")
6
Micro-fabrication process (lift-off) Exposed Areas Double Layer Resist Spin-coating EB Patterning Resist Development EB Deposition (1 A/sec) (FeNi target) Lift-off process FeNi circular dot Obtained circular dot array (AFM and SEM) Si substrate Permalloy, 1 m, t = 50 nm
 Exposed Areas Double Layer Resist Spin-coating EB Patterning Resist Development EB Deposition (1 A/sec) (FeNi target) Lift-off process FeNi circular dot Obtained circular dot array (AFM and SEM) Si substrate Permalloy, 1 m, t = 50 nm")
7
Magnetic Vortex State in circular ferromagnetic dot

8
Ferromagnetic resonance vs. Brillouin light scattering (BLS) FMR advantages High speed (1 minute per spectra with standard Bruker EMX-300 ESR spectrometer) High resolution (position of the mode can be determined with an accuracy of few Oersteds) External field can be applied at the arbitrary angle to the sample normal (in BLS only in the sample plane) It is possible to study relaxation processes by measuring resonance linewidth FMR disadvantages Lower sensitivity (for patterned 20 nm thick Permalloy minimal sample size is 0.2 mm x 0.2 mm) Fixed frequency Not all types of modes can be exited in FMR studies
 FMR advantages High speed (1 minute per spectra with standard Bruker EMX-300 ESR spectrometer) High resolution (position of the mode can be determined with an accuracy of few Oersteds) External field can be applied at the arbitrary angle to the sample normal (in BLS only in the sample plane) It is possible to study relaxation processes by measuring resonance linewidth FMR disadvantages Lower sensitivity (for patterned 20 nm thick Permalloy minimal sample size is 0.2 mm x 0.2 mm) Fixed frequency Not all types of modes can be exited in FMR studies.")
9
Rectangular arrays of magnetostatically coupled Ni dots 0.25 m 0.8 m 1 m 0.05 m 0.10 m It is known that Magnetostatic interaction in rectangular dot arrays affects the nucleation and annihilation fields, as well as the initial susceptibility. Ni_1Ni_2Ni_3Ni_4 Diameter (μm)1111 Thickness (nm)70 Interdot distance a (μm) 1111 Interdot distance b (μm) 0.050.10.250.8 Ni_1Ni_2Ni_3Ni_4
1111 Thickness (nm)70 Interdot distance a (μm) 1111 Interdot distance b (μm) Ni_1Ni_2Ni_3Ni_4.")
10
Ni dots and continuous film – out-of-plane FMR angular dependence

11
Ni dots – FMR in-plane angular dependence Ni_1 (H in-plane ~120 Oe) Ni_3 (H in-plane ~60 Oe) Ni_4 (H in-plane ~ 0 Oe) 0.05 m 0.25 m
 Ni_3 (H in-plane ~60 Oe) Ni_4 (H in-plane ~ 0 Oe) 0.05 m 0.25 m")
12
Modeling: an array of magnetostatically coupled dots k x = 2 /(2R+d x ) k y = 2 /(2R+d y ) 2R dydy dxdx For rectangular array of cylindrical dots we can obtain the following decomposition of the magnetostatic energy density (in units of M 2 and normalized per unit dot volume): where δ=d/R (d x =d) is the normalized inter- dot distance, =L/R, J 1 (x) is the Bessel fun-ction, φ k and φ H are the polar angles of the vectors k and H, respectively. The function K u (, δ) < 0 have sense of uniaxial anisotropy induced by interdot coupling with an easy magnetization axis parallel to the shor-test period T x of the rectangular dot array (φ H =0). K.Yu. Guslienko et.al. Phys. Rev. B 65, 024414 (2002).
 < 0 have sense of uniaxial anisotropy induced by interdot coupling with an easy magnetization axis parallel to the shor-test period T x of the rectangular dot array (φ H =0). K.Yu. Guslienko et.al. Phys. Rev. B 65, (2002)..")
13
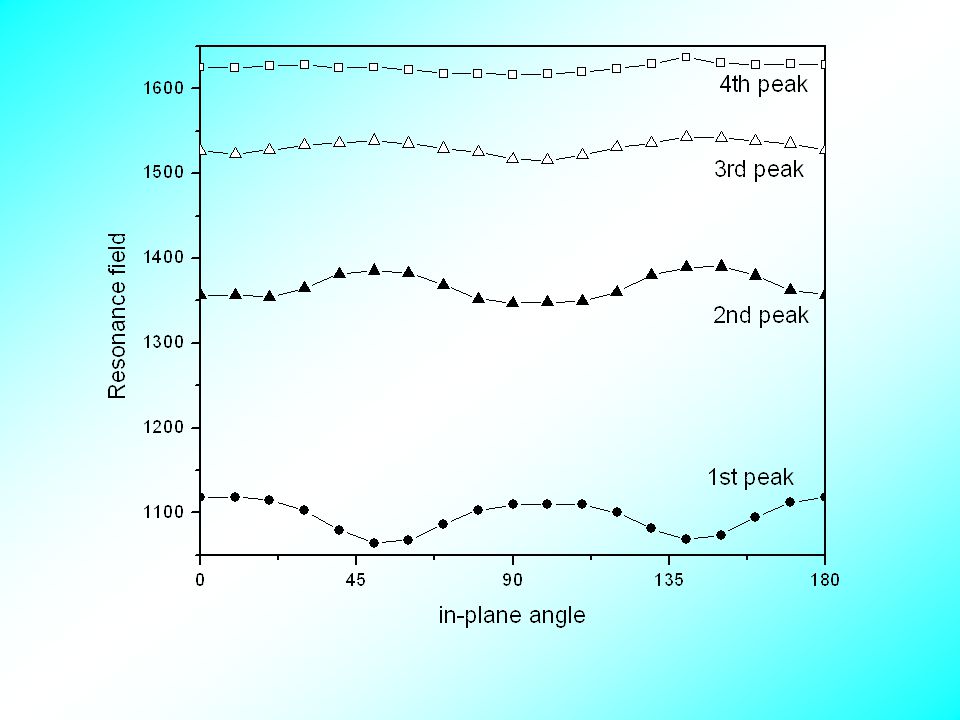
In-plane anisotropy in square array of Py dots Py square lattice of closely packed circular dots, 1/1.1 µm Four-fold anisotropy (FFA) fields for square arrays are significantly smaller than in-plane uniaxial anisotropy fields in rectangular arrays. However it is was not clear what is a source of FFA. In completely magnetized square arrays no anisotropy should appear at all.

14
Dependencies of the mean FMR field H r,av and 4th order anisotropy constant H 4 on the interdot spacing a in the square array of circular dots.

15
Correlations between 4-fold anisotropy and FMR resonance linewidth in square arrays of circular magnetic dots

16
Evidence of 8-fold anisotropy for closely packed square array of Py dots

17
Ferromagnetic resonance vs. Brillouin light scattering (BLS) FMR advantages High speed (1 minute per spectra with standard Bruker EMX-300 ESR spectrometer) High resolution (position of the mode can be determined with an accuracy of few Oersteds) External field can be applied at the arbitrary angle to the sample normal (in BLS only in the sample plane) It is possible to study relaxation processes by measuring resonance linewidth FMR disadvantages Lower sensitivity (for patterned 20 nm thick Permalloy minimal sample size is 0.2 mm x 0.2 mm) Fixed frequency Not all types of modes can be exited in FMR studies
 FMR advantages High speed (1 minute per spectra with standard Bruker EMX-300 ESR spectrometer) High resolution (position of the mode can be determined with an accuracy of few Oersteds) External field can be applied at the arbitrary angle to the sample normal (in BLS only in the sample plane) It is possible to study relaxation processes by measuring resonance linewidth FMR disadvantages Lower sensitivity (for patterned 20 nm thick Permalloy minimal sample size is 0.2 mm x 0.2 mm) Fixed frequency Not all types of modes can be exited in FMR studies.")
18
H = 2πM s 3 kOe H = 0 BLS studies of Ni nanowires in nanoporous alumina H ~ 2 kOe Z. K. Wang, M. H. Kuok, S. C. Ng, D. J. Lockwood, M. G. Cottam, K. Nielsh, R. B. Wehrsphon, and U. Gosele, Phys. Rev. Lett. 89, 027201 (2002). 1 μm 30 nm
. 1 μm 30 nm.")
19
Spin wave resonance in normally magnetized Ni dots (experiment) Ni witness continuous filmArray of Ni dots (Ni_1) When the applied field was close to normal of the sample, additional sharp resonant peaks were observed below the main ferromagnetic resonance peak. No sight of such periodic SW spectra was found for the reference Ni continuous film, which supports the idea that in dots SW modes with discrete frequencies due to restricted sample geometry will dominate.

20
Spin wave resonance in circular Ni dots For all the dot samples the differences ΔH r between neighbor modes, excluding the main one, were approximately the same ( ~ 250 Oe), indicating that the interdot interactions (different for each sample) do not affect magnetostatic spin wave modes in perpendicular geometry. 0.8 m 1 m 0.10 m

21
Two dimensional Bessel function modes of a disc (1,0) (2,0)(3,0)(4,0) Phase of the transverse (rf) moment For perpendicularly saturated cylindrical dots these modes have circular symmetry and are spatially non-uniform due to the non-ellipsoidal dot shape. Condition for the existing of standing waves between specific turning points leads to the quantization of the observed resonance fields.

22
Comparing theory and experiment Comparison of measured and calculated FMR resonance peak positions: (a)patterned Ni film, parameters used in calculation are M s = 484 G, γ/2π = 3.05 MHz/Oe, L=70 nm, R=500 nm, H = 1.84 kOe, A=8×10 -7 erg/cm; (b)patterned NiFe film, parameters used in calculation are M s =830 G, γ/2π = 2.96 MHz/Oe, L = 50 nm, R=500 nm, H =0, A=1.43 ×1 0 -6 erg/cm.
patterned Ni film, parameters used in calculation are M s = 484 G, γ/2π = 3.05 MHz/Oe, L=70 nm, R=500 nm, H = 1.84 kOe, A=8×10 -7 erg/cm; (b)patterned NiFe film, parameters used in calculation are M s =830 G, γ/2π = 2.96 MHz/Oe, L = 50 nm, R=500 nm, H =0, A=1.43 × erg/cm.")
23
Angular dependence of SWR in Py circular dots

24
Angular dependence of SWR in Py circular dots (contin.)
")
25
Out-of-plane angular dependence of the main peak Rm/n+dm R =0 (1) pinned d=, m R =0 unpinned d=0, m/n R=0 d is pinning parameter [1,2]. We can assume from experimental results that for perpendicularly magnetized dot (θ = 0 o ) pinned boundary conditions are realized, but for θ > 7 o uniform Kittel mode perfectly describes the experiment. For Kittel mode pure UNPINNED boundary conditions are valid. So, in the range 0 o < θ < 7 o d varies from to 0 and, consequently, the basic mode varies from J 0 (K ), where K is the first Bessel function root = 2.4, to J 0 (0 )=Kittel mode. Between these points K can be determined as a root of (1) with corresponding d. [1] K.Yu. Guslienko, S.O. Demokritov, B. Hillebrands, A.N.Slavin, PRB 66, 132402 (2002) [2] R. Zivieri, R.L. Stamps PRB 73, 144422 (2006)
![Out-of-plane angular dependence of the main peak Rm/n+dm R =0 (1) pinned d=, m R =0 unpinned d=0, m/n R=0 d is pinning parameter [1,2].](http://images.slideplayer.com/4/1430315/slides/slide_25.jpg "We can assume from experimental results that for perpendicularly magnetized dot (θ = 0 o ) pinned boundary conditions are realized, but for θ > 7 o uniform Kittel mode perfectly describes the experiment. For Kittel mode pure UNPINNED boundary conditions are valid. So, in the range 0 o < θ < 7 o d varies from to 0 and, consequently, the basic mode varies from J 0 (K ), where K is the first Bessel function root = 2.4, to J 0 (0 )=Kittel mode. Between these points K can be determined as a root of (1) with corresponding d. [1] K.Yu. Guslienko, S.O. Demokritov, B. Hillebrands, A.N.Slavin, PRB 66, (2002) [2] R. Zivieri, R.L. Stamps PRB 73, (2006).")
26
Transition from J 0 to J 1 near θ =0?

27
In-plane SWR in square array of Py dots Py square lattice of closely packed circular dots, 1/1.1 µm It is important to note that in-plane additional spin-wave modes for [10] and [11] are shifted in a different way with respect to the main one, indicating that interdot interactions DO AFFECT magnetostatic spin wave modes in in-plane geometry.
![In-plane SWR in square array of Py dots Py square lattice of closely packed circular dots, 1/1.1 µm It is important to note that in-plane additional spin-wave modes for [10] and [11] are shifted in a different way with respect to the main one, indicating that interdot interactions DO AFFECT magnetostatic spin wave modes in in-plane geometry.](http://images.slideplayer.com/4/1430315/slides/slide_27.jpg "In-plane SWR in square array of Py dots Py square lattice of closely packed circular dots, 1/1.1 µm It is important to note that in-plane additional spin-wave modes for [10] and [11] are shifted in a different way with respect to the main one, indicating that interdot interactions DO AFFECT magnetostatic spin wave modes in in-plane geometry.")
29
Ferromagnetic resonance vs. Brillouin light scattering (BLS) FMR advantages High speed (1 minute per spectra with standard Bruker EMX-300 ESR spectrometer) High resolution (position of the mode can be determined with an accuracy of few Oersteds) External field can be applied at the arbitrary angle to the sample normal (in BLS only in the sample plane) It is possible to study relaxation processes by measuring resonance linewidth FMR disadvantages Lower sensitivity (for patterned 20 nm thick Permalloy minimal sample size is 0.2 mm x 0.2 mm) Fixed frequency Not all types of modes can be exited in FMR studies
 FMR advantages High speed (1 minute per spectra with standard Bruker EMX-300 ESR spectrometer) High resolution (position of the mode can be determined with an accuracy of few Oersteds) External field can be applied at the arbitrary angle to the sample normal (in BLS only in the sample plane) It is possible to study relaxation processes by measuring resonance linewidth FMR disadvantages Lower sensitivity (for patterned 20 nm thick Permalloy minimal sample size is 0.2 mm x 0.2 mm) Fixed frequency Not all types of modes can be exited in FMR studies.")
30
Resonance linewidth For patterned film at perpendicular the linewidth is considerably smaller. This is because the density of spin-waves that the resonance can scatter into is much reduced, k min = 2π/d. At parallel the internal fields will be much more inhomogeneous leading to a stronger coupling to higher order spin-waves and a shorter relaxation time. As a function of angle from the perpendicular the inhomogeneities gradually increases and the linewidth increases.

31
MRFM Spectrometer Sputter Coated NiFe Tip Bias Field Solenoid (± 300 G) Bias Field H (permanent magnet) H Detection Cantilever (with H) RF Microstrip ( ) Sample on substrate Modulation Field, H mod Fiber optic interferometer x y z Force J. A. Sidles, Appl. Phys. Letts. 59, 2854 (1991) D. Rugar, C. S. Yannoni and J. A. Sidles, Nature, 360, 563 (1992)
 D. Rugar, C. S. Yannoni and J. A. Sidles, Nature, 360, 563 (1992).")
32
Resonance Slice Resonance Slice = H res F tip = m(r,t)dH/dz M H tip (r) H app < H res h(t) H int > H res B int < B res
dH/dz M H tip (r) H app < H res h(t) H int > H res B int < B res")
33
FMRFM spectra of circular dot array

34
Spatially resolved FMRFM

35
Conclusions FMR has shown its very high effectiveness in determination of different types of anisotropy in rectangular and square arrays of circular submicron dots It is shown that, even under strong enough FMR field H, the dipolar coupling in the square array of circular magnetic microdots is able to produce some continuous deformation of uniformly magnetized state, depending on the in- plane field orientation. We observed the multi-resonance FMR spectra of laterally confined spin wave modes in nickel and Permalloy circular dot arrays. These spectra are quantitatively described by a simple dipole-exchange theory of spin wave dispersion in a perpendicularly magnetized film. The global FMR properties of circular submicron dots determined using magnetic resonance force microscopy are in a very good agreement with results obtained using X-band conventional FMR and with theoretical description.

36
Acknowledgement V.O. Golub, E.V. Tartakovskaya Institute of Magnetism, Kiev, Ukraine P.C. Hammel Department of Physics, Ohio State University, USA A.N. Slavin Depertment of Physics, Oakland University, USA Yu.G. Pogorelov, M. Costa Department of Physics, University of Porto, Portugal K.Yu. Guslienko, V. Novosad Materials Science Division, Argonne National Laboratory, Y. Otani Frontier Research System, RIKEN, Japan S. Batra Seagate Research, Pittsburgh, USA

Similar presentations
 am Deutschen Elektronen.>")


 On the Ultimate Speed of Magnetic Switching Joachim Stöhr Stanford Synchrotron Radiation.>")
