Download presentation
Presentation is loading. Please wait.

1
A Comparison of Three Approaches to Tracking Undergraduate Students at Indiana University Regional Campuses Measurement Perspectives on Student Tracking

2
Purpose To provide a range of views of student persistence Traditional fall-to-fall retention and 150% graduation rates, and the years in between (i.e., student flow) The Adelman Model for more inclusive cohort tracking The persistence index: difference among campuses and academic divisions A conceptual warm-up for thinking about strategies for improving student success rates
 The Adelman Model for more inclusive cohort tracking The persistence index: difference among campuses and academic divisions A conceptual warm-up for thinking about strategies for improving student success rates")
3
Students Included in Each Method Example: 2006-07 as the base year First-time-in-college, enrolled full-time (12 + credits) during first fall semester; tracked for one and six years New to IU during summer, fall or spring of full academic year; enrolled for 6 or more credits in first fall or spring semester; tracked as traditional beginner, nontraditional beginner, or transfer; tracked for six and nine years All undergraduate, degree-seeking students enrolled in fall semester, categorized by class level, credit load, and need met/income status, tracked for one year
 during first fall semester; tracked for one and six years New to IU during summer, fall or spring of full academic year; enrolled for 6 or more credits in first fall or spring semester; tracked as traditional beginner, nontraditional beginner, or transfer; tracked for six and nine years All undergraduate, degree-seeking students enrolled in fall semester, categorized by class level, credit load, and need met/income status, tracked for one year")
4
Trends in Fall-to-Fall Retention Rates and 150% Graduation Rates, and Student Flow The Traditional Method

5
IU Regional Campus Retention Rates Retention Rates Cohort Year 20022003200420052006 Full-time Beginners Began2,5842,7462,6562,6092,623 Retained1,6741,7051,6181,5261,591 Retention Rate64.8%62.1%60.9%58.5%60.7% Bachelor's Intended FTB Began2,1892,3692,3842,4002,426 Retained1,4181,4931,4631,4141,479 Retention Rate64.8%63.0%61.4%58.9%61.0%

6
IU Regional Campus Graduation Rates Graduation Rates Cohort Year 19971998199920002001 Full-time Beginners Began2,3622,5572,4462,4502,590 Received Degree597624672638728 Graduation Rate25.3%24.4%27.5%26.0%28.1% Bachelor's Intended FTB Began2,0252,2382,1502,1912,267 Received Degree515522584559625 Graduation Rate25.4%23.3%27.2%25.5%27.6% 150% for Bachelors, Associates and Certificates 150% for Bachelors, Associates and Certificates 150% for Bachelors Only 150% for Bachelors Only

7
Student Flow Tables Semester-to-semester view of retention/graduation Extension of traditional cohort reporting Full-time beginner cohorts (2001-2006) Intercampus persistence Intercampus degree completion Results may differ from official reports Updates to cohorts Exclusions/exceptions not considered (military) Degree completion post 150% (Cert./Assoc.) May 31, 2014Customize footer: View menu/Header and Footer
 Intercampus persistence Intercampus degree completion Results may differ from official reports Updates to cohorts Exclusions/exceptions not considered (military) Degree completion post 150% (Cert./Assoc.) May 31, 2014Customize footer: View menu/Header and Footer")
8
May 31, 2014Customize footer: View menu/Header and Footer IU Regional Campuses: Percent Enrolled or Degree Conferred among Full-time Beginners Year 1Year 2Year 3Year 4Year 5Year 6Year 7 CohortCountFallSpringFallSpringFallSpringFallSpringFallSpringFallSpringFall 20012,598100%85%67%58%52%48%46%43%42%41%40%39% 20022,584100%84%65%57%52%48%45%43%42%41%40%.. 20032,747100%83%62%55%48%44%40%39%37%.... 20042,659100%82%61%54%47%42%40%...... 20052,608100%81%58%50%46%........ 20062,630100%79%61%.......... 2001-200615,826100%83%62%55%49%46%43%41%40%41%40%39% Full-time Beginners Full-time Beginners Year Numbers Coordinate with Cohort Year Numbers Coordinate with Cohort For 2002 Cohort Year 3 is 2004-05 For 2002 Cohort Year 3 is 2004-05 For 2003 Cohort Year 3 is 2005-06 For 2003 Cohort Year 3 is 2005-06 No Information for Spring 08 and Fall 08 6-Cohort Aggregate 6-Cohort Aggregate 1 Cohort Less Stable? 1 Cohort Less Stable? Fall, Year 1 Is Enrollment at First Semester Fall, Year 1 Is Enrollment at First Semester Spring, Year 1 Is Retention to Second Semester Spring, Year 1 Is Retention to Second Semester Fall, Year 2 Is Retention to Second Year Fall, Year 2 Is Retention to Second Year

9
May 31, 2014Customize footer: View menu/Header and Footer Semester, Year Number Fall Semester, Year 1 Spring Semester, Year 6 Includes Certificates and Associates Degrees Beyond 150% Includes Certificates and Associates Degrees Beyond 150% Step Pattern? 100% for First Fall Does trend line level off?

10
May 31, 2014Customize footer: View menu/Header and Footer TotalYear 1Year 2 CohortCountFallSpringFallSpring 20012,598100%85%67%58% 20022,584100%84%65%57% 20032,747100%83%62%55% 20042,659100%82%61%54% 20052,608100%81%58%50% 20062,630100%79%61%. TotalYear 1Year 2 CohortCountFallSpringFallSpring 20012,598100%85%67%58% 20022,584100%84%65%57% 20032,747100%83%62%55% 20042,659100%82%61%54% 20052,608100%81%58%50% 20062,630100%79%61%. Retention to the Second Semester Retention to the Second Semester Retention to the Second Year

11
Subgroup Tables Gender Race White, Other (African American, Hispanic) Age < 20, 20-24, 25+ Geographic Origin Home County, Other (Res/Non-res) Financial Need Filed FAFSA and Need > $0 May 31, 2014Customize footer: View menu/Header and Footer
 Age < 20, 20-24, 25+ Geographic Origin Home County, Other (Res/Non-res) Financial Need Filed FAFSA and Need > $0 May 31, 2014Customize footer: View menu/Header and Footer")
12
May 31, 2014Customize footer: View menu/Header and Footer IU Regional Campuses: Percent Enrolled or Degree Conferred among Full-time Beginners Year Subgroup Tables1257 CohortCountSpringFall GenderFemale20011,63886%68%43%42% 20021,60186%68%45%. 20031,70285%65%39%. 20041,65384%64%.. 20051,58582%59%.. 20061,56081%62%.. Male200196083%64%41%35% 200298382%59%36%. 20031,04581%57%35%. 20041,00679%56%.. 20051,02380%57%.. 20061,07077%59%.. Important Indicators of First Year Experience Degree Completion through Years 4 and 6

13
A More Inclusive Method for Cohort Tracking The Adelman Model

14
Beyond the Traditional Cohort Traditional CohortAdelman Cohort Fall semester as starting point Any term of an academic year (July 1 – June 30) Full-time (12+ credits) only 6 or more first term credits One cohort Three subgroups: – Traditional beginner (<24 yrs) – Nontraditional beginner (24+) – Transfer Six-year terminal point - graduation only Six & Nine year terminal points, graduated or still enrolled Track nationally using NSC (optional)
 Full-time (12+ credits) only 6 or more first term credits One cohort Three subgroups: – Traditional beginner (<24 yrs) – Nontraditional beginner (24+) – Transfer Six-year terminal point - graduation only Six & Nine year terminal points, graduated or still enrolled Track nationally using NSC (optional)")
15
Application 1: The Early Years Going back to 1997-98 thru 2001-02 Nine year tracking for first two cohorts Six Year tracking for all Traditional/nontraditional distinction among beginners based solely on age (<24, 24+) First examine size and distribution of cohorts Then look at status after six and nine years
 First examine size and distribution of cohorts Then look at status after six and nine years")
16
The Early Cohorts

19
Trends in Six-Year Status Percent Graduated or Still Enrolled

20
Trends in Nine-Year Status Percent Graduated or Still Enrolled

21
Comparison to Regional Composite

22
Application 2: More Recent Years AY 2004-05 thru 2006-07 Refine the traditional/nontraditional distinction Nontraditional as either financially independent or dependent/no FAFSA and age 24+ First look at cohort size and group distribution Then examine the first few years of persistence Through the fourth year for 2004-05 cohorts Through the third year for 2005-06 cohorts Through the second year for 2006-07 cohorts

23
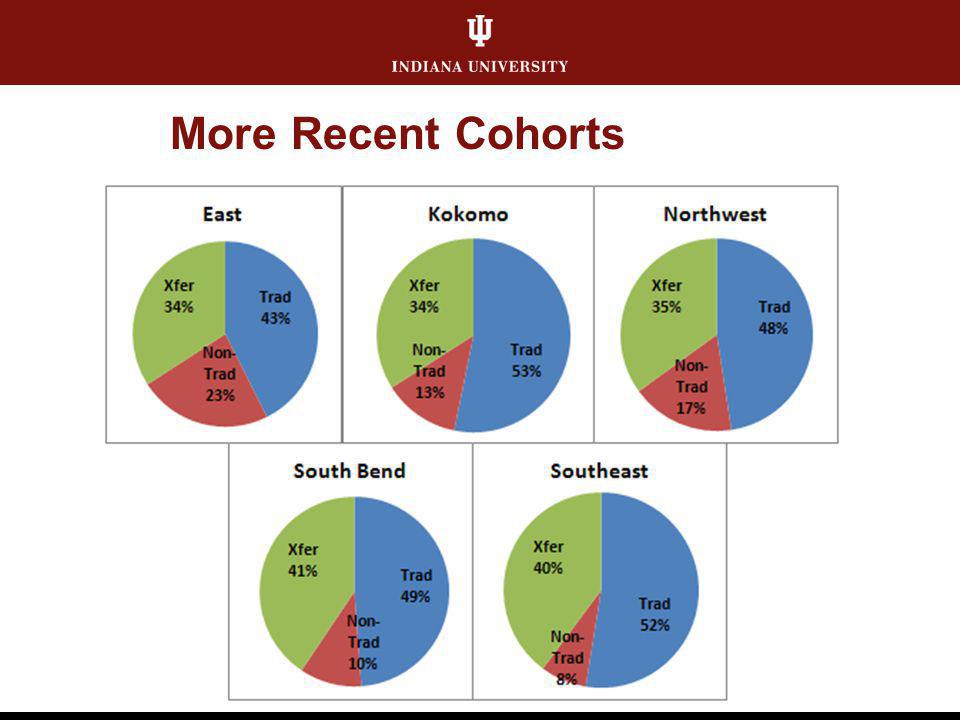
More Recent Cohorts

25
The Early Cohorts

26
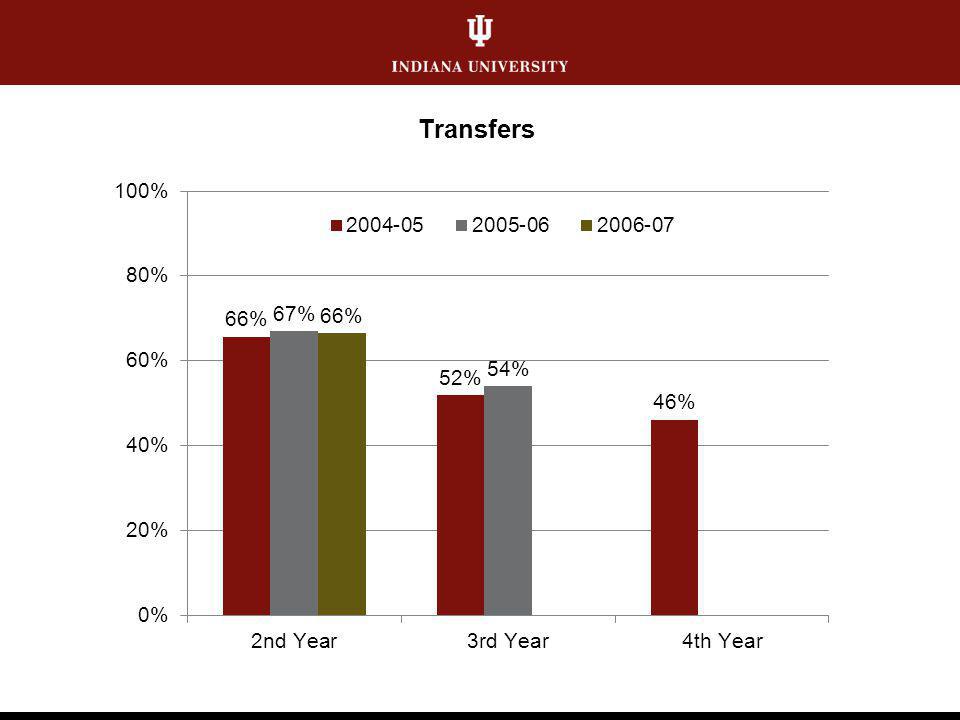
Yearly Persistence Status Cohort N2nd Year3rd Year4th Year Traditional Beginners 2004-052,82062%47%39% 2005-062,90960%45% 2006-072,95362% Combined8,68261%46%39% Non-Traditional Beginners 2004-0579558%37%30% 2005-0678559%39% 2006-0770259% Combined2,28259%38%30% Transfers 2004-052,09566%52%46% 2005-062,24167%54% 2006-072,28766% Combined6,62366%53%46%

30
Comparison to Regional Composite

31
Accounting for All Students and Examining Differences in Patterns among Campuses and Academic Groupings The Persistence Index

32
Methodology Considers all undergraduate, degree-seeking students in a given fall semester Fall 2006 for the present analysis Tracks them to the next fall semester Enrolled fall 2007 or received degree 2006-07 Divides them into three sets of categories Class level: 1st year; beyond 1st year Credit load: 6 or fewer credits; 7-12.5 credits; 13+ credits Need met/Income status

33
Methodology (2) Categories derived from analysis of cut-points that optimize group differences in retention Chi-square automatic interaction detection (CHAID) Need met/Income indicator more complicated Percent of need met positively associated with persistence among those of known income Income positively associated with persistence among those who did not have need assessed Strange relationship among those with need assessed but no known income Many students missing both (no FAFSA at all)
 Categories derived from analysis of cut-points that optimize group differences in retention Chi-square automatic interaction detection (CHAID) Need met/Income indicator more complicated Percent of need met positively associated with persistence among those of known income Income positively associated with persistence among those who did not have need assessed Strange relationship among those with need assessed but no known income Many students missing both (no FAFSA at all)")
34
The Need Met/Income Indicator

35
The Persistence Index Categories

36
Methodology (3) Array students in matrix according to the combination of all three factors (2x3x3) Determine percent of students in each cell Calculate persistence rates for each cell Results Examine pattern of campus cell rates to composite matrix rates Calculate the persistence index by multiplying cell rates by composite percentages (common weights) Can group students by academic division, across campuses, to compare rates by division
 Array students in matrix according to the combination of all three factors (2x3x3) Determine percent of students in each cell Calculate persistence rates for each cell Results Examine pattern of campus cell rates to composite matrix rates Calculate the persistence index by multiplying cell rates by composite percentages (common weights) Can group students by academic division, across campuses, to compare rates by division")
37
The Persistence Index Matrix: Counts All Regional Campuses, Combined (N=19,138)
")
38
The Persistence Index Matrix: Percentages All Regional Campuses, Combined

39
The Persistence Index Matrix: Persistence Rates All Regional Campuses, Combined

40
A Campus Example

41
The Rate and Cell Summary Table

42
Academic Division Comparisons

43
Division Summary Table

44
Campus Summary by Division

Similar presentations


 pantry survey found that.>")


 patients Policy.>")


 Grants Chapter 6.>")
