Download presentation
Presentation is loading. Please wait.

1
STRATEGY GENERIC STRATEGIES FOUR P’S MAPS & MATRIXES
SWOT, OPPORTUNITY & THREAT, BOSTON GROWTH SHARE, PRODUCT LIFE CYCLE, COMPETITOR MAP, PERCEPTUAL MAP TARGET MARKET & SEGMENTATION

2
Chapter 1 Market Driven Strategy (info on customers, competitors, market) and Deliver superior customer value Distinctive Capabilities (competencies) Provide Customer Value
 Provide Customer Value.")
3
Figure 1-7: Contrasts Between the Sales Concept and the Marketing Concept

4
Group Exercise What do you think are product and market definitions for the following? Missouri-Pacific Railroad? Xerox? Standard Oil? Colombia Pictures? Example: Carrier Product: We make air conditioners and furnaces Market: We provide climate control in the home

5
Table 4.1: Product-Oriented versus Market-Oriented Definitions of a Business
Company Product Definition Market Definition Missouri-Pacific Railroad We run a railroad We are a people-and-goods mover Xerox We make copying equipment We help improve office productivity Standard Oil We sell gasoline We supply energy Columbia Pictures We make movies We market entertainment Encyclopaedia We sell encyclopedias We distribute Information Carrier We make air conditioners and furnaces We provide climate control in the home

6
Chapter 2 STRATEGY FORMULATION Define Corporate mission Set Objectives
Determine Strategic Business Units Establish strategic Guidelines

7
DESIRABLE CAPABILITIES
Superior to the Competition Applicable to Multiple Competitive Situations Difficult to Duplicate Source: George S. Day, Journal of Marketing, October 1994, 49. TM 1-6

8
Chapter 2 CORPORATE STRATEGY Management’s long term vision
Objective milestones toward vision Assets, skills, capabilities Business Composition Structure, Systems & Processes

9
Chapter 2 MARKETING STRATEGY SEGMENTATION TARGET MARKETS
POSITIONING (4P’s) IMPLEMENTATION & MANAGEMENT
 IMPLEMENTATION & MANAGEMENT.")
10
Company Orientations Toward the Marketplace
Target Market Customer Needs Stated needs Real needs Unstated needs Delight needs Secret needs

11
Chapter 3 Market Opportunity Analysis
1) Define Product Markets 2) Analyze End Users 3) Industry & Value Chain Analysis 4) Evaluate Key Competitors 5) Estimate Market Size & Growth Competitor Map pg. 97 Perceptual Map pg. 103
 Define Product Markets. 2) Analyze End Users. 3) Industry & Value Chain Analysis. 4) Evaluate Key Competitors. 5) Estimate Market Size & Growth. Competitor Map pg. 97. Perceptual Map pg")
12
Defining and Analyzing Markets #3
Define Product-Market Boundaries and Structures Describe and Analyze End-User Analyze Industry & Value Added System Evaluate Key Competitors Forecast Market Size & Growth Trends McGraw-Hill/Irwin © 2003 The McGraw-Hill Companies, Inc., All Rights Reserved. TM 3-6

13
Generic Competition Strategies
Overall Cost Leadership Need high market share, efficient facilities, cost reduction, tight overhead, no marginal customer accounts, raw materials access, re-investments Differentiation Unique: design, technology, features, service... Focus Specific buyer group, segment of a product line, geographic market...

14
Overall Cost Leadership
Sustained capital investments Process engineering skills Products designed for ease in manufacture Low cost distribution system Tight cost control Frequent, detailed reports Incentives based on quantitative targets

15
Differentiation Strong marketing abilities
Product engineering & creative flair Strong research & function coordination Reputation for quality or leadership Subjective incentives & measurements Amenities to attract high-caliber people FOCUS: Above, directed at specific target

16
Competitive Strategy-Broad formula: How to compete, set goals, policies to achieve goals
COMPET. FORCES Entry Threat of substitution Buyer bargaining power Supplier bargaining power Current competitor rivalry ENTRY BARRIERS Economies of scale Product differentiation Capital requirements Switching costs Access to distribution Cost disadvantages Government

17
Figure 1-5: The Four P Components of the Marketing Mix

18
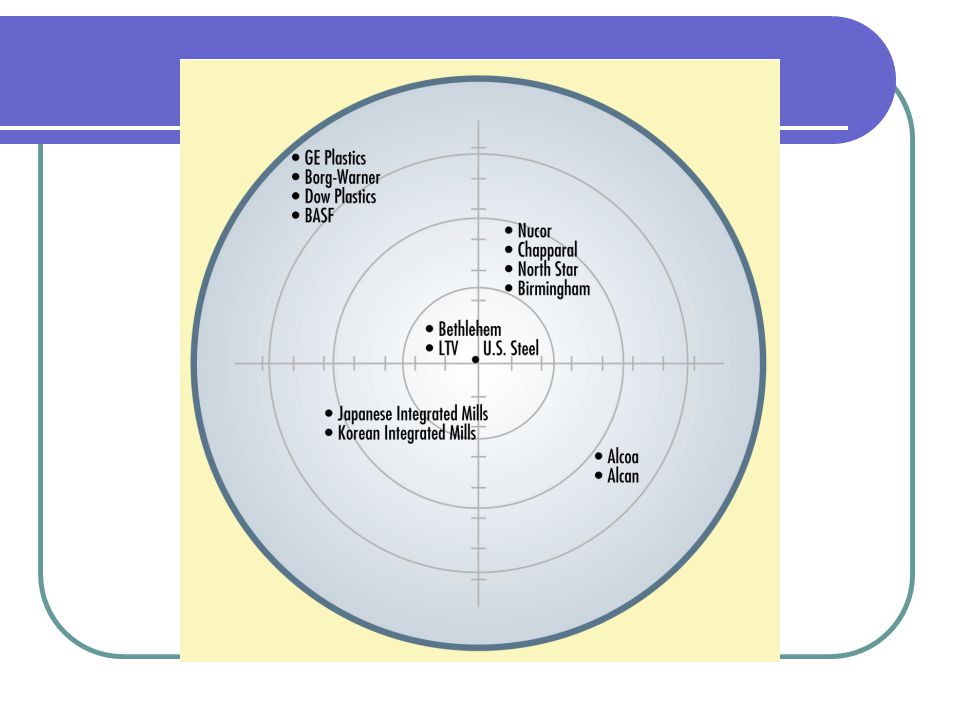
Figure 9-3: Competitor Map – Eastman Kodak

20
BOSTON Growth Share Matrix

21
Figure 4-5: Three Intensive Growth Strategies: Ansoff’s Product-Market Expansion Grid

22
Figure 4-7: Opportunity and Threat Matrices

23
DESCRIBING AND ANALYZING END-USERS
Identifying and Describing Buyers #3 Building Customer Profiles DESCRIBING AND ANALYZING END-USERS How Buyers Make Choices Environmental Influences McGraw-Hill/Irwin © 2003 The McGraw-Hill Companies, Inc., All Rights Reserved. TM 3-7

24
Illustrative Example: Gasoline Buyers #4
Road Warriors Higher-income, middle-aged men, drive miles a year … buy premium with a credit card … purchase sandwiches and drinks from the convenience store … will sometimes use carwash 16% of buyers True Blues Men and women with moderate to high incomes, loyal to a brand and sometimes a particular station … frequently buy premium, pay in cash 16% of buyers Generation F3 (Fuel, Food & Fast) Upwardly mobile men and women - half under 25 years of age - constantly on the go … drive a lot snack heavily from the convenience store 27% of buyers Homebodies Usually housewives who shuttle children around during the day and use whatever gas station is based on town or on route of travel 21% of buyers Price Shoppers Not loyal to brand or station and rarely buy premium … frequently on tight budgets. 20% of buyers TM 4-10 McGraw-Hill/Irwin © 2003 The McGraw-Hill Companies, Inc., All Rights Reserved.
 Upwardly mobile men and women - half under 25 years of age - constantly on the go … drive a lot. snack heavily from the convenience. store. 27% of. buyers. Homebodies. Usually housewives who shuttle. children around during the day and. use whatever gas station is based on. town or on route of travel. 21% of. buyers. Price. Shoppers. Not loyal to brand or station and. rarely buy premium … frequently on. tight budgets. 20% of. buyers. TM McGraw-Hill/Irwin. © 2003 The McGraw-Hill Companies, Inc., All Rights Reserved.")
25
Illustrative Consumer Perception Map #4
Expensive GROUP II Brand A Brand E Brand B GROUP V Low Quality High Quality GROUP I GROUP III Brand C Brand D GROUP IV TM 4-11 McGraw-Hill/Irwin Inexpensive © 2003 The McGraw-Hill Companies, Inc., All Rights Reserved.

26
A Framework for Market Sensing #5
Probability of the Event Occurring High Medium Low 7 Field of Utopia 6 Dreams 5 Effect of the Event on the Things to Company* 4 Watch 3 Future 2 Danger Risks 1 * 1=Disaster, 2=Very bad, 3=Bad, 4=Neutral, 5=Good, 6=Very good, 7=Ideal TM 5-4 McGraw-Hill/Irwin © 2003 The McGraw-Hill Companies, Inc., All Rights Reserved.

27
Figure 11.3: Sales and Profit Life Cycles

28
Product Life-Cycle Marketing Strategies

29
Issues in Collecting and Using Information #6
Invasion of customer privacy e.g., use of medical databases to sell healthcare products Information and ethics e.g., guidelines for sharing of confidential information TM 5-13 McGraw-Hill/Irwin © 2003 The McGraw-Hill Companies, Inc., All Rights Reserved.

30
Bargaining Power of Buyers
Concentrated or large volume sales Purchased products are a significant fraction of buyer’s costs Products are standard or undifferentiated There are few switching costs Low profits - pressure on suppliers Buyers pose threat of backward integration Buyer has full information

31
Bargaining Power of Suppliers
Concentrated suppliers, fragmented buyers Little substitution threat Customer is not an important buyer Supplier’s product is important input High buyer switching costs Suppliers pose threat of forward integration Government - defense, timber, regulation

32
Rivalry: Price competition, advertising, product introductions, customer service..
Numerous Competitors: More mavericks Slow Industry Growth High Fixed or Storage Costs (Excess capacity often leads to price wars) Lack of Differentiation = commodity Foreign Competitors High Strategic Stakes High Exit Costs
 Lack of Differentiation = commodity. Foreign Competitors. High Strategic Stakes. High Exit Costs.")
33
Likelihood of retaliation to entry
History of retaliation Established firms with substantial resources such as cash, borrowing capacity, excess productive capacity, distribution leverage Established firms with illiquid industry assets Slow industry growth - can’t absorb new competition.

34
Figure 9-2: Barriers and Profitability

Similar presentations