Download presentation
Presentation is loading. Please wait.

1
LSA-SAF Event Week 2011 Carlos C. DaCamara Associate Professor IDL – University of Lisbon Email: cdcamara@fc.ul.pt Session 5 FIRE RISK

2
BACKGROUND Fire-related processes have long been identified as applications with great potential to be derived from Meteosat/SEVIRI.

3
BACKGROUND The growing number of users of Meteosat information for agricultural and forestry applications, together with the growing demands for environmental monitoring and risk management has led EUMETSATs LSA SAF to commit to the development of a new line of research aiming to explore the capability of Meteosat/SEVIRI to detect and monitor active fires over Africa and Europe.

4
BACKGROUND As a result, the LSA SAF is currently disseminating on an operational basis the following products:

5
BACKGROUND As a result, the LSA SAF is currently disseminating on an operational basis the following products: the Fire Risk Mapping (FRM) product, that provides daily maps of meteorological fire risk over Mediterranean Europe;
 product, that provides daily maps of meteorological fire risk over Mediterranean Europe;")
6
BACKGROUND As a result, the LSA SAF is currently disseminating on an operational basis the following products: the Fire Risk Mapping (FRM) product, that provides daily maps of meteorological fire risk over Mediterranean Europe; the Fire Detection and Monitoring (FD&M) product, that provides a continuous monitoring of fire activity over Africa and Europe;
 product, that provides daily maps of meteorological fire risk over Mediterranean Europe; the Fire Detection and Monitoring (FD&M) product, that provides a continuous monitoring of fire activity over Africa and Europe;")
7
BACKGROUND As a result, the LSA SAF is currently disseminating on an operational basis the following products: the Fire Risk Mapping (FRM) product, that provides daily maps of meteorological fire risk over Mediterranean Europe; the Fire Detection and Monitoring (FD&M) product, that provides a continuous monitoring of fire activity over Africa and Europe; The Fire Radiative Power (FRP) product that allows the estimation of carbon emissions from the vegetation fires.
 product, that provides daily maps of meteorological fire risk over Mediterranean Europe; the Fire Detection and Monitoring (FD&M) product, that provides a continuous monitoring of fire activity over Africa and Europe; The Fire Radiative Power (FRP) product that allows the estimation of carbon emissions from the vegetation fires.")
8
LSA-SAF Event Week 2011 Carlos C. DaCamara Associate Professor IDL – University of Lisbon Email: cdcamara@fc.ul.pt Session 5 Part 1 PRE-FIRE CONDITIONS

9
INTRODUCTION Rural fires are common events on ecosystems characterized by alternating rainy and drought periods, which inevitably lead to high levels of vegetation stress and to the accumulation of fuels during the dry phase.

10
INTRODUCTION Rural fires are common events on ecosystems characterized by alternating rainy and drought periods, which inevitably lead to high levels of vegetation stress and to the accumulation of fuels during the dry phase. QUESTION: In what part of Europe is this particularly true?

11
INTRODUCTION This is particularly true in Mediterranean Europe, where the rainy and mild winters followed by warm and dry summers make the region especially prone to the occurrence of a large number of fire events.

12
INTRODUCTION This is particularly true in Mediterranean Europe, where the rainy and mild winters followed by warm and dry summers make the region especially prone to the occurrence of a large number of fire events. QUESTION: In what time of the year do the most severe fire episodes take place?

13
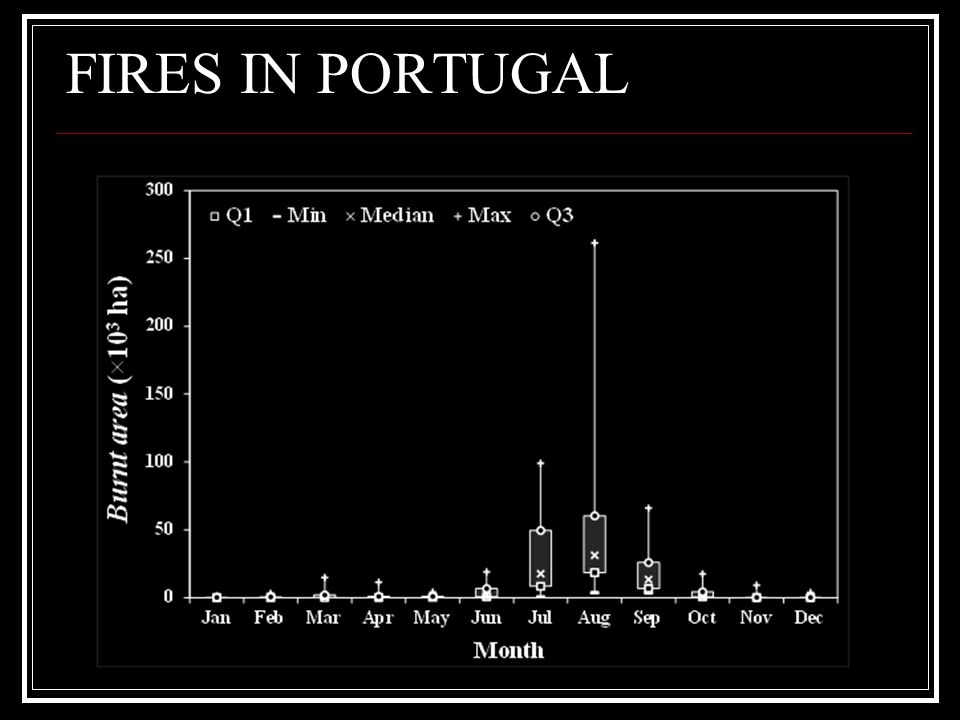
FIRES IN PORTUGAL PORTUGAL has been strongly affected by wildfires. According to the most recent inventory provided by the National Forest Authority (Autoridade Florestal Nacional, AFN), over 5 million hectares have burned during 1980-2006, of which the impressive amount of 1 million ha concentrates in the 3-year period of 2003-2005.
, over 5 million hectares have burned during , of which the impressive amount of 1 million ha concentrates in the 3-year period of")
14
FIRES IN PORTUGAL

17
CLIMATE & WEATHER ANOMALIES The aim of this lesson is to demonstrate that the extent of burnt area in Portugal is mainly controlled by two different types of meteorological factors associated to two different temporal scales:

18
CLIMATE & WEATHER ANOMALIES The aim of this lesson is to demonstrate that the extent of burnt area in Portugal is mainly controlled by two different types of meteorological factors associated to two different temporal scales: the climate anomaly which relates to the existence of long dry periods with absence of precipitation in late spring and early summer;

19
CLIMATE & WEATHER ANOMALIES We begin by demonstrating that the extent of burnt area in Portugal is mainly controlled by two different types of meteorological factors associated to two different temporal scales: the climate anomaly which relates to the existence of long dry periods with absence of precipitation in late spring and early summer; the weather anomaly which relates to the occurrence of very intense dryspells in days of extreme synoptic situations.

20
WHAT IS NDVI? Red light is strongly absorbed by photosynthetic pigments found in green leaves, whereas near-infrared is highly reflected by live leaf tissues, regardless of their color. Areas of bare soil on the contrary tend to appear similar in both the red and near- infrared wavelengths.

21
WHAT IS NDVI? QUESTION What are the values of NDVI to be expected for vegetation and bare soil surfaces?

22
WHAT IS NDVI? QUESTION What are the values of NDVI to be expected for vegetation and bare soil surfaces? Answer: The typical range of actual values of NDVI is about 0.1 for bare soils to 0.9 for dense vegetation.

23
EXTREME YEARS

24
SEVERE YEARS WEAK YEARS

25
EXTREME YEARS SEVERE YEARS

26
EXTREME YEARS SEVERE YEARSWEAK YEARS

27
2003 versus 2005 2003 2005

28
CLIMATE vs. WEATHER ANOMALIES T P (summer) is the pyrogenic temperature defined by:
 is the pyrogenic temperature defined by:")
29
CLIMATE vs. WEATHER ANOMALIES

30
Climate anomaly

31
CLIMATE vs. WEATHER ANOMALIES Climate anomaly Meteorological anomaly

32
LSA-SAF Event Week 2011 Carlos C. DaCamara Associate Professor IDL – University of Lisbon Email: cdcamara@fc.ul.pt Session 5 Part 2 THE FRM PRODUCT

33
The Fire Risk Mapping product The FRM product is based on:

34
The Fire Risk Mapping product The FRM product is based on: Information about vegetation type from GLC200. Vegetation type provides an indication about available fuel and flammabiltiy;

35
The Fire Risk Mapping product The FRM product is based on: Information about vegetation type from GLC200. Vegetation type provides an indication about available fuel and flammabiltiy; Information about location and duration of fire events as obtained from the Fire Detection & Monitoring product (details will be provided in Session 6);
;.")
36
The Fire Risk Mapping product The FRM product is based on: Information about vegetation type from GLC200. Vegetation type provides an indication about available fuel and flammabiltiy; Information about location and duration of fire events as obtained from the Fire Detection & Monitoring product (details will be provided in Session 6); The Fire Weather Index, that uses meteorological data to empirically estimate the available fuel and fire spread rate. Data used to calculate FWI are derived from daily meteorological fields of ECMWF analyses.
; The Fire Weather Index, that uses meteorological data to empirically estimate the available fuel and fire spread rate. Data used to calculate FWI are derived from daily meteorological fields of ECMWF analyses..")
37
The Fire Weather Index

38
The Generalized Pareto distribution Active fire duration is defined by the number of consecutive MSG slots (1 MSG slot = 15 minutes) where an active fire is identified in a given pixel.
 where an active fire is identified in a given pixel.")
39
The Generalized Pareto distribution Active fire duration is defined by the number of consecutive MSG slots (1 MSG slot = 15 minutes) where an active fire is identified in a given pixel. It was found that the decimal logarithm of active fire duration tends to follow a Generalized Pareto (GP) distribution.
 distribution..")
40
The Generalized Pareto distribution

41
Active fire duration distribution QUESTION: Witch curve corresponds to each vegetation type? The background model Forest Shrub Cultivated areas

42
Active fire duration distribution The background model Forest Shrub Cultivated areas

43
Active fire duration distribution The FWI model QUESTION: Which curve corresponds to highest FWI?

44
Active fire duration distribution The FWI model

45
Mapping fire risk (background model) Risk of occurrence of active fires with a duration exceeding pre-defined threshold (150 minutes)
 Risk of occurrence of active fires with a duration exceeding pre-defined threshold (150 minutes)")
46
Mapping fire risk (background model) Risk of occurrence of active fires with a duration exceeding pre-defined threshold (150 minutes) Active fire duration (in minutes) associated to a risk of occurrence of fire (25%)
 Risk of occurrence of active fires with a duration exceeding pre-defined threshold (150 minutes) Active fire duration (in minutes) associated to a risk of occurrence of fire (25%)")
47
Mapping fire risk (FWI model) Risk of occurrence of active fires with a duration exceeding pre-defined threshold (150 minutes) 24/07/07 25/08/07 31/08/09
 Risk of occurrence of active fires with a duration exceeding pre-defined threshold (150 minutes) 24/07/07 25/08/07 31/08/09")
48
Fire risk QUESTION: Can you tell where it is likely to have a fire event? FWI model – 24/07/07 Background model

49
Risk anomaly Combining the static maps of the background model (which depends on vegetation only) with the daily maps of the FWI model (which also uses FWI as a covariate) provides better indication on whether meteorological conditions are aggravating or mitigating fire risk. Background risk Background GP model Active fire duration GP model with FWI Fire risk Maps of risk anomaly Risk anomaly – 24/07/07

50
Classes of fire risk 15%5%0%-10% Very highHighModerateLowVery low

51
An happy ending! ]0-0.5]]0.5-2.5]]2.5-5]] 5-7.5]>7.5 h
![An happy ending! ]0-0.5]] ]]2.5-5]] 5-7.5]>7.5 h](http://images.slideplayer.com/3/1398958/slides/slide_51.jpg "An happy ending! ]0-0.5]] ]]2.5-5]] 5-7.5]>7.5 h")
Similar presentations


 Work progress in WP6.2.>")


 Brazil EUMETRAIN.>")


