Download presentation
Presentation is loading. Please wait.

1
EMMREM Predicted Dose Rates for CRaTER N. Schwadron, L. Townsend, K. Kozarev, H. Spence, M. Golightly et al.

2
Motivator..

3
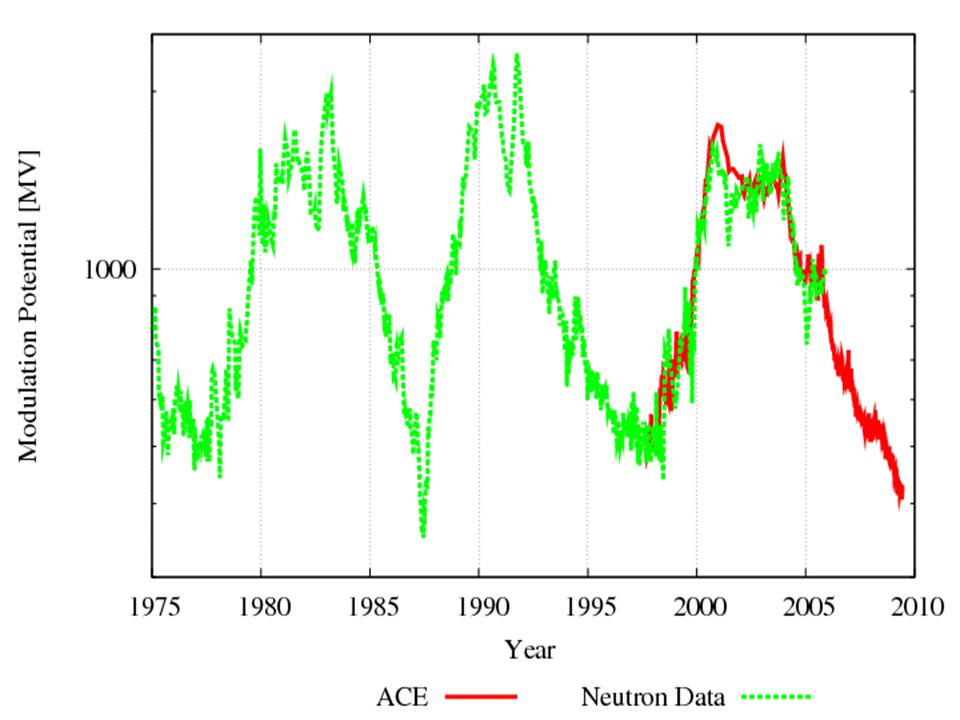
Modulation Potential Modulation potential, Φ = |Z e|φ(r); barrier to penetrations of CRs Integral in (1) extends from the inner boundary at radius r to the outer modulation boundary R b, Solar wind speed is V (x) and 1 (x) is related to the radial diffusion coefficient, based on fit to observed spectrum over time and species [O’Neil and Badhwar, 2006]: = 1 (r) P β where P is the rigidity in GV, β is the particle speed over the speed of light, 1 (r) 1 + (r/r 0 ) 2 and r 0 = 4 AU Reductions in modulation potential are caused by enhanced diffusion, allowing greater access and therefore higher fluxes of GCRs in the inner heliosphere
![Modulation Potential Modulation potential, Φ = |Z e|φ(r); barrier to penetrations of CRs Integral in (1) extends from the inner boundary at radius r to the outer modulation boundary R b, Solar wind speed is V (x) and 1 (x) is related to the radial diffusion coefficient, based on fit to observed spectrum over time and species [O’Neil and Badhwar, 2006]: = 1 (r) P β where P is the rigidity in GV, β is the particle speed over the speed of light, 1 (r) 1 + (r/r 0 ) 2 and r 0 = 4 AU Reductions in modulation potential are caused by enhanced diffusion, allowing greater access and therefore higher fluxes of GCRs in the inner heliosphere](http://images.slideplayer.com/9/1395992/slides/slide_3.jpg "Modulation Potential Modulation potential, Φ = |Z e|φ(r); barrier to penetrations of CRs Integral in (1) extends from the inner boundary at radius r to the outer modulation boundary R b, Solar wind speed is V (x) and 1 (x) is related to the radial diffusion coefficient, based on fit to observed spectrum over time and species [O’Neil and Badhwar, 2006]: = 1 (r) P β where P is the rigidity in GV, β is the particle speed over the speed of light, 1 (r) 1 + (r/r 0 ) 2 and r 0 = 4 AU Reductions in modulation potential are caused by enhanced diffusion, allowing greater access and therefore higher fluxes of GCRs in the inner heliosphere")
6
Predictions for LRO CRaTER

7
Revisions to Original Predictions The extended solar minimum shows lowest field strengths through space age; but why isn’t the modulation potential at a minimum? – Base modulation potential on ACE and Thule Neutrons.. Characterize modulation potential in terms of field strength (extensions back to Maunder Minimum and before) Is there an effect of the shrinking heliopshere in the extended solar minimum?
 Is there an effect of the shrinking heliopshere in the extended solar minimum .")
8
Revised Modulation Potential

9
Revised Doses using Thule Neutron Monitor Data

10
Modulation Potential Modulation potential, Φ, should scale with some power of the field strength or radial field strength Motivated by recent work on the Closed flux ejected by CMEs over the solar cycle

11
CMEs Add Closed Flux To Heliosphere

12
Model for CME Injection of Closed Magnetic Flux

13
Correlation Between Field Strenght and Modulation Potential

14
-- Annual 10 Be data (1428–1930) averaged with binomial filter; the other data are annual averages. -- Line Cnm(LIS) estimated pseudo-Climax counting rate in the absence of any solar modulation -- Heavy lines indicate the levels of “residual modulation” during the four Gleissberg maxima. -- Arrows between 1533 and 1686 are at 22-year intervals -- Removed Effects of long-term change in geo dipole, and prod. of 10 Be by solar cosmic rays McCracken and Beer, JGR, 2007
 estimated pseudo-Climax counting rate in the absence of any solar modulation -- Heavy lines indicate the levels of residual modulation during the four Gleissberg maxima. -- Arrows between 1533 and 1686 are at 22-year intervals -- Removed Effects of long-term change in geo dipole, and prod. of 10 Be by solar cosmic rays McCracken and Beer, JGR,")
15
-- Estimated annual average heliospheric magnetic field strength near Earth, 1428–2005 -- heavy lines are estimates of the heliomagnetic floor values for the several Gleissberg cycles McCracken, JGR, 2007 Derived from Cosmic Ray Record

16
Modulation Potential Paleo Record Field strengths reduced by 5-10 from historical record Implications modulation potentials of 6-20 (as opposed to 400 currently) Need to run much smaller modulation potentials to know how bad the environment can get
 Need to run much smaller modulation potentials to know how bad the environment can get")
17
Is there an Effect of the Shrinking Heliosphere? Reduction in modulation potential more than adequately accounted for by changes in field strength The effect of a reduction in size of heliosphere remains elusive

18
Takeaway We have a story to tell with dose rate comparison – But we are missing the comparison part

Similar presentations


 South exit SAA Kress,>")


