Download presentation
Presentation is loading. Please wait.

1
Tidewater Community College Mr. Joyner, Dr. Julia Arnold and
Area and the Definite Integral Tidewater Community College Mr. Joyner, Dr. Julia Arnold and Ms. Shirley Brown using Tan’s 5th edition Applied Calculus for the managerial , life, and social sciences text

2
Area and the Definite Integral
Suppose a state’s annual rate of oil consumption each year over a 4-year period is a constant function, such as f(t) = 2, where t is measured in years and f(t) is measured in millions of barrels. We would graph such a function as:
 = 2, where t is measured in years and f(t) is measured in millions of barrels. We would graph such a function as:")
3
Area and the Definite Integral
How could you use the graph to answer the question, “How much oil was used during the four years”? Answer: 2(4-0) = 8 million barrels It seems reasonable that the answer is 8 million barrels and this is the same as the area of the rectangle…the area under the “curve.” (Yes, even a straight line is considered a “curve” in mathematics!)
 = 8 million barrels. It seems reasonable that the answer is 8 million barrels and this is the same as the area of the rectangle…the area under the curve. (Yes, even a straight line is considered a curve in mathematics!)")
4
Area and the Definite Integral
How would you find the area above the x-axis and under the curve f(x) = x from x = 0 to x = 4? Does it seem reasonable to find the area of the triangle… the area under the “curve.”
 = x from x = 0 to x = 4 Does it seem reasonable to find the area of the triangle… the area under the curve.")
5
Area and the Definite Integral
Imagine now that our function, f(x) = x, represents the oil consumption of the same state over the same four years. What was the oil consumption over the four years? Let’s explore.
 = x, represents the oil consumption of the same state over the same four years. What was the oil consumption over the four years Let’s explore.")
6
Area and the Definite Integral
For the first year, the state started off consuming no oil (zero barrels per year), and ended the year consuming oil at the rate of 1 million barrels per year. Since the rate of increased consumption is linear, we can use the average rate of change over the year to represent the entire first year. The average rate of change over the first year is (1 – 0)/2 = 0.5 million barrels per year. For one year, (the first year) the amount of oil consumed is: 1(0.5) = 0.5 million barrels
, and ended the year consuming oil at the rate of 1 million barrels per year. Since the rate of increased consumption is linear, we can use the average rate of change over the year to represent the entire first year. The average rate of change over the first year is (1 – 0)/2 = 0.5 million barrels per year. For one year, (the first year) the amount of oil consumed is: 1(0.5) = 0.5 million barrels.")
7
Area and the Definite Integral
For the first two years, the state started off consuming no oil and ended the two-year year period consuming oil at the rate of 2 million barrels per year. Again, since the rate of increased consumption is linear, we can use the average rate of change over the 2 years to represent the entire two-year period. The average rate of change over the 2-year period is (2 – 0)/2 = 1 million barrels per year. For two years. the amount of oil consumed is: 2(1) = 2 million barrels.
/2 = 1 million barrels per year. For two years. the amount of oil consumed is: 2(1) = 2 million barrels.")
8
Area and the Definite Integral
In a similar fashion we can reason that the total oil consumption is as follows: Total Number of Years Average Rate of Consumption Total oil consumption 1 .5 1(.5) = .5 2 2(1) = 2 3 1.5 3(1.5) = 4.5 4 4(2) = 8 Lets compare these values to… the areas of the right triangles under the curve f(x).
 = (1) = (1.5) = (2) = 8. Lets compare these values to… the areas of the right triangles under the curve f(x).")
9
Area and the Definite Integral
Triangle areas: Base (total number of years) Height (average rate of consumption) Area = ½(bh) (total oil consumption) 1 ½(1)(1) = 0.5 2 ½(2)(2) = 2 3 ½(3)(3) = 4.5 4 ½(4)(4) = 8 We get the same values!
 Height. (average rate of consumption) Area = ½(bh) (total oil consumption) 1. ½(1)(1) = ½(2)(2) = ½(3)(3) = ½(4)(4) = 8. We get the same values!")
10
Area and the Definite Integral
How would we find the area under the following curve and above the x-axis? f(x) x The work is a little more complex, but the approach is the same… area under the curve!
 x. The work is a little more complex, but the approach is the same… area under the curve!")
11
Area and the Definite Integral
We could use rectangles to approximate the area. f(x) x First, divide the horizontal base with a partition. We will start with a partition that has two equal subintervals: [0,1] and [1,2]
 x. First, divide the horizontal base with a partition. We will start with a partition that has two equal subintervals: [0,1] and [1,2]")
12
Area and the Definite Integral
In this slide, the subinterval rectangles have been drawn using the right-hand endpoints of each subinterval. We could have used the left endpoints, the midpoints of the intervals, or any point in each subinterval. 1 2 1unit 22 +1 = 5 = 2

13
Area and the Definite Integral
The area of the first rectangle is 2 and is greater than the area under the curve. The area of the second rectangle is 5 and is also greater than the area under the curve. 5 2 1 1 2 1 The total area of the rectangles is = 7 which is greater than the desired area under the curve.

14
Area and the Definite Integral
In this slide, let’s draw the rectangles using the left-hand endpoints. 12 +1 = 2 = 1 2 1 1unit 1unit

15
Area and the Definite Integral
Now, let’s calculate the areas of these new rectangles. The area of the first rectangle is 1 x 1 = 1 and is less than the area under the curve. 1 2 1unit The area of the second rectangle is 1 x 2 = 2 and is also less than the area under the curve. The total area of the rectangles using the left-hand endpoints is = 3 which is less than the desired area under the curve.

16
Area and the Definite Integral
Now we know that the area under the curve must be between 3 and 7. Can we get a more accurate answer? Yes! And to do so, we need to construct more subintervals using a finer partition.

17
Area and the Definite Integral
Area Under A Curve The area under a curve on an interval can be approximated by summing the areas of individual rectangles on the interval. If the rectangles are inscribed under the curve, the approximated area will be less than the desired area. (In our example, this area was 3.) If the rectangles are circumscribed above the curve, the area will be greater than the desired area. (In our example, this area was 7.)
 If the rectangles are circumscribed above the curve, the area will be greater than the desired area. (In our example, this area was 7.)")
18
Area and the Definite Integral
Area Under A Curve By using a finer partition (one with more subintervals), we make each rectangle narrower (increasing their number), and we get an area value that is closer to the true area under the curve. By taking the limit as n (the number of rectangles) approaches infinity, the actual area is approached. This is our limiting process where we let n approach infinity
, we make each rectangle narrower (increasing their number), and we get an area value that is closer to the true area under the curve. By taking the limit as n (the number of rectangles) approaches infinity, the actual area is approached. This is our limiting process where we let n approach infinity.")
19
Area and the Definite Integral
Area Under A Curve Definition: A sum such as the one below is called a Riemann sum: This is our limiting process where we let n approach infinity

20
Area and the Definite Integral
Area Under A Curve The area under a curve can be approached by taking an infinite Riemann sum. Let f(x) be a nonnegative, continuous function on the closed interval [a, b]. Then, the area of the region under the graph of f(x) is given by where x1, x2, x3, … xn are arbitrary points in the n subintervals of [a,b] of equal width This is our limiting process where we let n approach infinity
 be a nonnegative, continuous function on the closed interval [a, b]. Then, the area of the region under the graph of f(x) is given by. where x1, x2, x3, … xn are arbitrary points in the n subintervals. of [a,b] of equal width . This is our limiting process where we let n approach infinity.")
21
Area and the Definite Integral
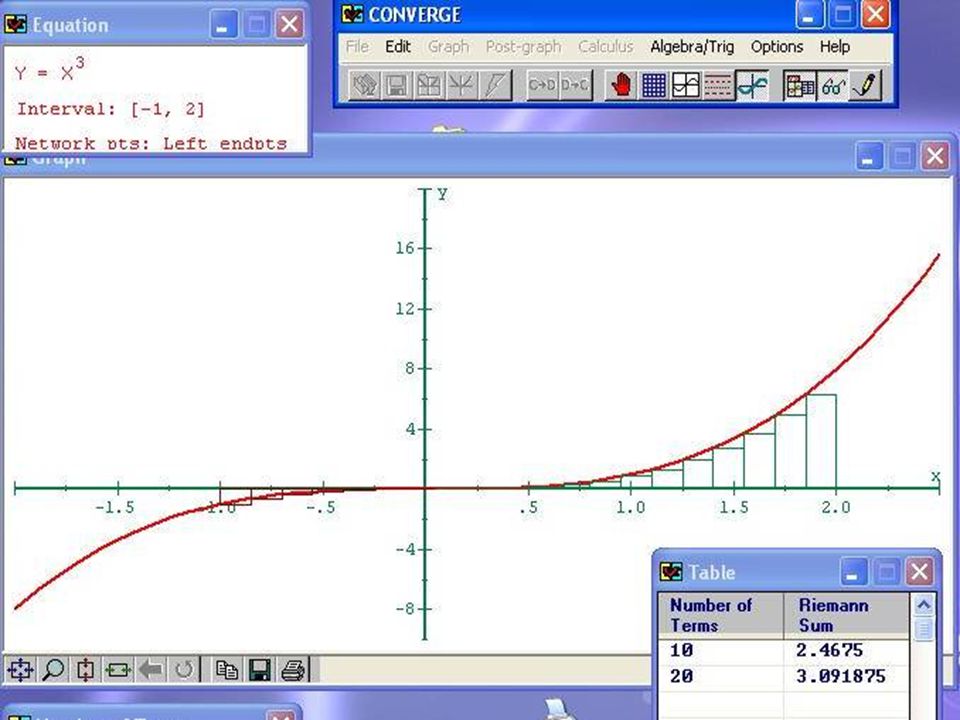
On the following six slides, you will see the number of rectangles increasing for the graph of y = x3 on the interval [-1, 2] . Observe the way that the area of rectangles more closely approximates the area under the curve as the number of rectangles increases.

28
Area and the Definite Integral
As you can see, the sum of the areas of the rectangles increases as you increase the number of rectangles. When there are 10 rectangles, Area 20 rectangles, Area 40 rectangles, Area 100 rectangles, Area 1000 rectangles, Area 5000 rectangles, Area As the number of rectangles increases, they begin to better “fit” the curve giving a closer and closer approximation of the area (3.75) under the curve and above the x-axis.
 under the curve and above the x-axis.")
29
Area and the Definite Integral
We are almost done with this lesson in that we can now turn our attention to the definition and discussion of the definite integral for all functions, not just nonnegative functions.

30
Area and the Definite Integral
Definition: The Definite Integral Let f(x) be defined on [a,b]. If exists for all choices of representative points x1, x2, x3, … xn in the n subintervals of [a,b] of equal width , then this limit is called the definite integral of f(x) from a to b and is denoted by The number a is the lower limit of integration, and the number b is the upper limit of integration.
 be defined on [a,b]. If. exists for all choices of representative points x1, x2, x3, … xn in the n subintervals of [a,b] of equal width , then this limit is called the definite integral of f(x) from a to b and is denoted by . The number a is the lower limit of integration, and the number b is the upper limit of integration.")
31
Area and the Definite Integral
Definition: The Definite Integral Thus As long as f(x) is a continuous function on a closed interval, it has a definite integral on that interval. f(x) is said to be integrable when its integral exists.
 is a continuous function on a closed interval, it has a definite integral on that interval. f(x) is said to be integrable when its integral exists.")
32
Area and the Definite Integral
Please make this important distinction between the indefinite integral of a function and the definite integral of a function: The indefinite integral of a function is another function. example: The definite integral of a function is a number. example: You will learn how to calculate this number in the next section of your textbook.

33
Area and the Definite Integral
Let’s take a quick look at the geometric interpretation of the definite integral, and we’ll be done. If f(x) is a nonnegative, continuous function on [a, b], then is equal to the area of the region under the graph of f(x) on [a, b].
 is a nonnegative, continuous function on [a, b], then is equal to the area of the region under the graph of f(x) on [a, b].")
34
Area and the Definite Integral
If f(x) is a nonnegative, continuous function on [a, b], then is equal to the area of the region under the graph of f(x) on [a, b]. f(x) y x a b What happens if f(x) is not always nonnegative?
 is a nonnegative, continuous function on [a, b], then is equal to the area of the region under the graph of f(x) on [a, b]. f(x) y. x. a. b. What happens if f(x) is not always nonnegative")
35
Area and the Definite Integral
If f(x) is simply a continuous function on [a, b], then is equal to the area of the region below the graph of f(x) and above the x-axis minus the area of the region above the graph of f(x) and below the x-axis on [a, b]. f(x) y x a b Area of region 1 – Area of region 2 + Area of region 3
 is simply a continuous function on [a, b], then is equal to the area of the region below the graph of f(x) and above the x-axis minus the area of the region above the graph of f(x) and below the x-axis on [a, b]. f(x) y. x. a. b. Area of region 1 – Area of region 2 + Area of region 3.")
36
Area and the Definite Integral
Let’s look at a problem similar to #3 of the section 6.3 Exercises (page 475) in the textbook. We shall use right endpoints. Let f(x) = 3x. Part a: Sketch the region R under the graph of f(x) on the interval [0,2] and find its exact area using geometry.
 in the textbook. We shall use right endpoints. Let f(x) = 3x. Part a: Sketch the region R under the graph of f(x) on the. interval [0,2] and find its exact area using geometry.")
37
Area and the Definite Integral
Solution - Part a: Since the area under the curve from [0,2] forms a right triangle, we can calculate the exact area using the geometry formula A= ½ bh ; b = 2 and h = 6, so ½ (2)(6) = 6 6 f(x) = 3x 4 2 Area = 6 1 2
(6) = f(x) = 3x Area =")
38
Area and the Definite Integral
Let f(x) = 3x. Part b: Use a Riemann sum with four subintervals (n = 4) of equal length to approximate the area of region R. Choose the representative points to be the right endpoints of the subintervals.
 = 3x. Part b: Use a Riemann sum with four subintervals (n = 4) of. equal length to approximate the area of region R. Choose the representative points to be the right. endpoints of the subintervals.")
39
Area and the Definite Integral
Solution – Part b: Divide the length of the interval (2) by the number of subintervals (4). Each subinterval has a length equal to ½ unit; . This produces the 4 subintervals: [0, 1/2], [1/2, 1], [1, 3/2], and [3/2, 2] . 1 2 1/2 3/2 f(x) = 3x The Riemann Sum is A = [f(1/2) + f(1) + f(3/2) + f(2)](1/2)
 by the number of subintervals (4). Each subinterval has a length equal to ½ unit; . This produces the 4 subintervals: [0, 1/2], [1/2, 1], [1, 3/2], and [3/2, 2] /2. 3/2. f(x) = 3x. The Riemann Sum is. A = [f(1/2) + f(1) + f(3/2) + f(2)](1/2)")
40
Area and the Definite Integral
Let f(x) = 3x. Part c: Repeat part (b) with eight subintervals (n = 8) of equal length.
 = 3x. Part c: Repeat part (b) with eight subintervals (n = 8) of. equal length.")
41
Area and the Definite Integral
Solution – Part c: Divide the length of the interval (2) by the number of subintervals (8). Each subinterval has a length equal to 1/4 unit; . This produces the 8 subintervals: [0, 1/4], [1/4, 1/2], [1/2, 3/4], [3/4, 1] . [1, 5/4], [5/4, 3/2], [3/2, 7/4], and [7/4, 2] The Riemann Sum is A = [f(1/4) + f(1/2) + f(3/4) + f(1) + f(5/4) + f(3/2) + f(7/4) + f(2)](1/4)
 by the number of subintervals (8). Each subinterval has a length equal to 1/4 unit; . This produces the 8 subintervals: [0, 1/4], [1/4, 1/2], [1/2, 3/4], [3/4, 1] . [1, 5/4], [5/4, 3/2], [3/2, 7/4], and [7/4, 2] The Riemann Sum is. A = [f(1/4) + f(1/2) + f(3/4) + f(1) + f(5/4) + f(3/2) + f(7/4) + f(2)](1/4)")
42
Area and the Definite Integral
Let f(x) = 3x. Part d: Compare the approximations obtained in parts (b) and (c) with the exact area found in part (a). Do the approximations improve with larger n ? Solution – Part d: Compare the values. What is you conclusion? Hopefully, you see that the approximation does improve with a finer partition (and thus, larger values of n).
 = 3x. Part d: Compare the approximations obtained in parts (b) and. (c) with the exact area found in part (a). Do the. approximations improve with larger n Solution – Part d: Compare the values. What is you conclusion Hopefully, you see that the approximation does improve with a finer partition (and thus, larger values of n).")
Similar presentations


![1 Example 2 Estimate by the six Rectangle Rules using the regular partition P of the interval [0, ] into 6 subintervals. Solution Observe that the function.](/19/5802866/big_thumb.jpg "1 Example 2 Estimate by the six Rectangle Rules using the regular partition P of the interval [0, ] into 6 subintervals. Solution Observe that the function.>")


![Aim: Riemann Sums & Definite Integrals Course: Calculus Do Now: Aim: What are Riemann Sums? Approximate the area under the curve y = 4 – x 2 for [-1, 1]](/24/7261222/big_thumb.jpg "Aim: Riemann Sums & Definite Integrals Course: Calculus Do Now: Aim: What are Riemann Sums? Approximate the area under the curve y = 4 – x 2 for [-1, 1]>")


