Download presentation
Presentation is loading. Please wait.

1
Regional distribution of ethnicities
Chapter 7: Ethnicity: Where are ethnicities distributed?

2
Ethnicity in the U.S. Latinos: 14% of the U.S. population
African Americans: 12% of the U.S. population Asian American: 4% American Indian: 1%

3
Regional Concentrations
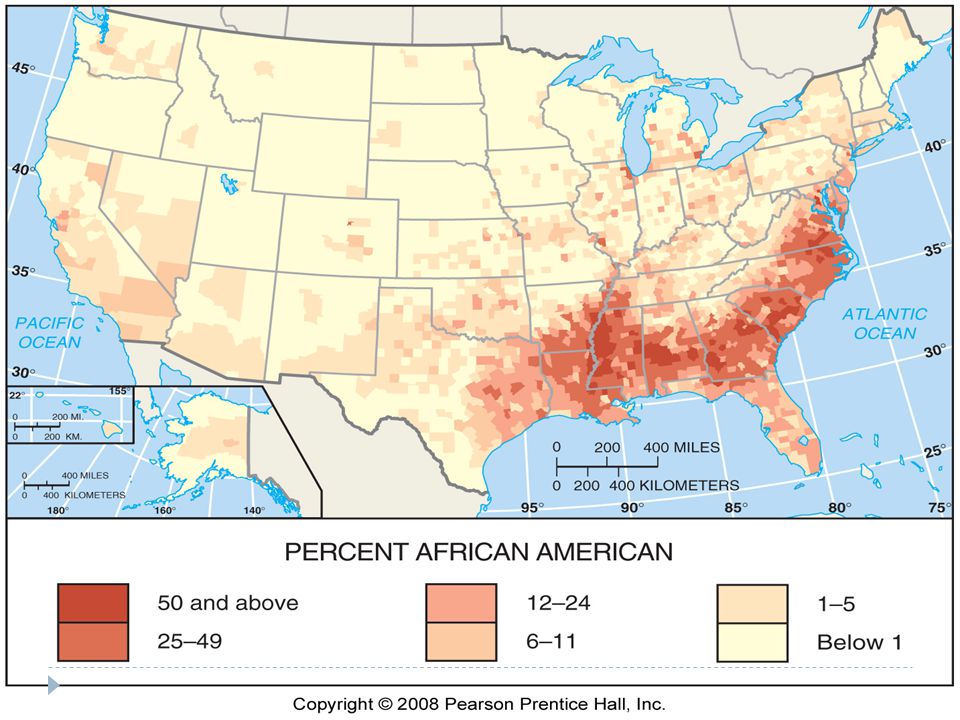
African Americans are clustered in the Southeast. Hispanics in the Southwest. Asian Americans in the West. American Indians in the Southwest and Plains.

4
African Americans Alabama Georgia Louisiana Maryland South Carolina
25% or Greater are African American Less than 1% are African American Alabama Georgia Louisiana Maryland South Carolina Mississippi Maine New Hampshire Vermont Idaho Montana North Dakota South Dakota Utah Wyoming

6
Hispanic v. Latino/Latina
A 1995 census study showed: 58% of Americans of Latin descent prefer the term Hispanic 12% prefer the term Latino/Latina 64% come from Mexico 10% from Puerto Rico 4% from Cuba Clustered from the following states: California: 30% Texas: 20% Florida: 15% New York: 15%

8
Asian American 4% of U.S. population.
23% Chinese 19% Indian 18% Filipino 10% Korean 10% Vietnamese 7% Japanese 13% others Largest concentration of Asian Americans is in Hawaii, followed by California.

10
American Indians Within the lower 48 (continental U.S.) American Indians are most populous in the Southwest and Plains states.
 American Indians are most populous in the Southwest and Plains states.")
12
Distribution within cities
Where are ethnicities distributed?

13
African Americans African Americans are highly clustered within cities. ¼ of all Americans live in cities, while over ½ of African Americans are city dwellers. At the state level it becomes even more concentrated. Michigan is 7% African American while Detroit is 85% A.A.

14
Racial Distribution in Chicago

15
Hispanic Population Distribution
In states with the largest distribution (CA and TX) many urban areas are more than ½ Hispanic.
 many urban areas are more than ½ Hispanic.")
16
Clustering About 90% of Hispanic and African American ethnicities live in metro areas compared with 75% of the rest of the population. Discussion Question: What effect does this have on desegregation? How has this concentration affected education and the school systems, specifically the Brown v. Board of Education decision?

17
Historical Impact of Ethnic Clusters in Metro Areas
This clustering has been happening in cities since the early part of the 20th century. Cities like Chicago, Cleveland, Detroit, etc attracted immigrants from Southern and Eastern Europe to factory jobs. This led to the expansion of ethnic neighborhoods: Greektown, Little Italy, Poletown. Most of these immigrants moved out of the cities after a generation or so. Their ethnic identity is rooted more in religion, food, etc and not location. These neighborhoods were then filled with ethnicities that are most commonly found in urban areas today.

18
Migration Patterns African Americans

19
Distribution Distribution of ehtnicities is explained in the same way as other cultural factors: migrations. These factors shape the distribution of African Americans in the U.S.: Forced migration from Africa to U.S. South to North after the Civil War Movement from ghettos to urban neighborhoods after the civil rights movement to the present.

20
Forced Migration: Slave Trade
Between 1710 and 1810 an estimated 10 million slaves were shipped to the western hemisphere. This included but was not limited to the U.S. Most British slaves went to the Caribbean and Portuguese went to Brazil. Many Africans living on the west coast would use their tools and weapons to capture people living further inland and sell them to the Europeans. At the height of the slave trade Europeans used the triangular slave trade.

21
Forced Migration: Slave Trade
Leave Europe with materials to buy slaves. Transport slaves and gold from Africa to the Caribbean. Carry sugar and molasses back to Europe.

22
Slave Ships Approximately ¼ of salves died on the trip due to the terrible conditions. Most were packed in so tightly that the number of dead wasn’t known until they reached their destination. They were kept in chains and barely fed. Stronger and younger villagers were often seized first due to their high value.

23
Movement North After the Civil War and the end of slavery many African Americans moved North. East: Baltimore, Philadelphia, New York and Boston. Central: Detroit, Cleveland West: St. Louis, Chicago Southwest: California, Los Angles

25
North American Ghetto Movement
African Americans who moved to cities ended up in the same neighborhoods as blacks who were already there. These neighborhoods became known as ghettos after the term for Jewish neighborhoods in the Middle Ages. In 1950 most of Baltimore’s AA lived in a 1 square mile area NW of downtown. This map shows the expansion of AA neighborhoods.

26
Ethnicity & Race Ethnicities display different cultural traditions that originate at particular hearths. Asian is a race recognized by the census, Asian American is an ethnicity. African American and black are different groups. Not all blacks are of African descent. African American infers a cultural background while black simply refers to skin color. Hispanic is not considered a race according to the U.S. census.

27
Race Traits that characterize race are genetic.
Lactose Intolerance Affects: 95% of Asian Americans 65% of African Americans 65% of Native Americans 50% of Hispanics 15% of European Americans Most Europeans have a genetic mutation that continues to produce lactase, enabling them to digest lactose for their whole lives.

28
Usefulness of “Race” as a term
At best: biological features very so widely as to be almost unscientific At worst: it is a basis for racism and the belief that one race has superior biological characteristics.

29
Separate But Equal in the U.S.
Plessy v. Ferguson Brown v. Board of Education Jim Crow laws

30
South Africa: Apartheid
While the U.S. was ending segregation laws South Africa was creating laws. The legal system in S.A. was called apartheid or physical separation of geographic areas.

31
Classfications Under aparthied a newborn was 1 of 4 races.
Black White Colored (mixed white and black) Asian Under these classifications it was determined where you could live, work, go to school, etc. This system was created by the settlers from Holland who settled in Cape Town in These people became known as Afrikaans, the name of their language.
 Asian. Under these classifications it was determined where you could live, work, go to school, etc. This system was created by the settlers from Holland who settled in Cape Town in These people became known as Afrikaans, the name of their language.")
32
Apartheid

33
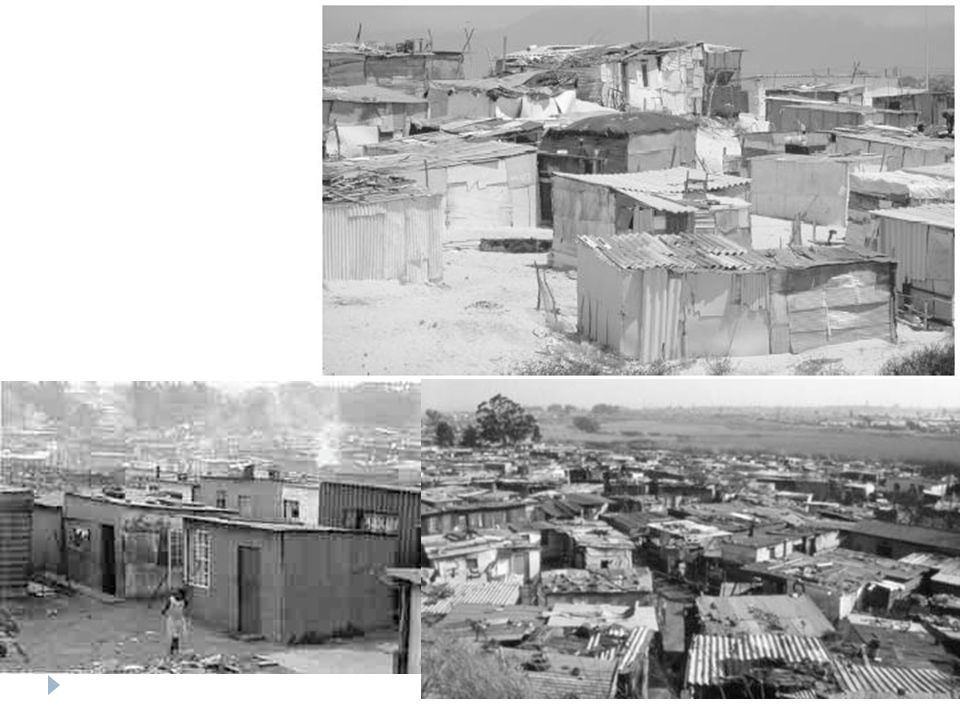
Afrikaans Resistance While colonies lost power in African in the 20th century the Afrikaans vowed not to turn the government of South Africa over to the blacks. Apartheid laws were to created to force blacks out of powerful positions and allow whites to thrive economically and politically. This government created “homelands” for blacks where they were expected to move and live, removing the black population from the rest of society.

36
Changes Despite the multiple revolutionaries in South Africa, including Nelson Mandela, apartheid wasn’t repealed until Mandela, who was jailed for 27 years for being a member of the African National Congress and advocating black takeover of the government, was elected President of South Africa in 1994. While apartheid is over, the effects of the segregation have been longer lasting: Economic disparity Avg. income is about 10 times lower than white S.A.

Similar presentations


. INTRODUCTION >")


