Download presentation
Presentation is loading. Please wait.

1
Rural Health in an Era of Health Reform
February 3, 2017 Timothy D. McBride, PhD Brown School Washington University in St. Louis

2
So What is Rural America?
Although the word disaprities has cache here … in rural policy work the word that often comes up is differential … Dependent variables often looked at ….

3
What is the character of an area? Which of these are rural areas?
County 1 County 2 County 3 Median family income $74,875 $42,748 $27,553 Percent below poverty 9.1% 23.8% 30.4% In Labor Force 66.7% 63.9% 54.1% College degree or more 38.3% 24.8% 8.4% Female-headed households 13.1% 20.3% 18.5% Percent foreign born 5.8% 6.6% 0.9% Percent non-white 26.7% 53.7% 28.2%

4
What is the character of an area?
St. Louis County St. Louis City Pemiscot Median family income $74,875 $42,748 $27,553 Percent below poverty 9.1% 23.8% 30.4% In Labor Force 66.7% 63.9% 54.1% College degree or more 38.3% 24.8% 8.4% Female-headed households 13.1% 20.3% 18.5% Percent foreign born 5.8% 6.6% 0.9% Percent non-white 26.7% 53.7% 28.2% Population 994,098 354,620 20,047 County Urban Rural

5
Triangulation… Rural, Suburban, and Urban America

6
Defining Rural in Missouri and Illinois

7
Rural Demographics, Missouri and Illinois
Growth through March 2015: Marketplace enrollment: Missouri: 253,432 Illinois: 349,483 U.S.: 8.84 million Medicaid: Missouri: 72,741 (+8.3%) Illinois: 529,228 (+20.2%) U.S.: 12.8 million (+22.2%) Medicaid expansion states: +29.2% Non-Medicaid expansion states: +9.5% Uninsured percentages are prior to ACA implementation in Missouri and Illinois. Social Determinants of Health for Missouri and Illinois Average per Capita Income, 2013 Poverty Rate 2013 Percent that did not complete high school, 2013 Unemployment Rate 2013, Rural Rural Statewide Urban Missouri $33,430 $40,663 18.00% 14.30% 17.30% 10.70% 6.70% 6.50% Illinois $46,980 $39,886 15.30% 14.60% 12.60% 12.70% 9.40% 9.10% SOURCE: Rural Assistance Center, State Guides,
 Illinois: 529,228 (+20.2%) U.S.: 12.8 million (+22.2%) Medicaid expansion states: +29.2% Non-Medicaid expansion states: +9.5% Uninsured percentages are prior to ACA implementation in Missouri and Illinois. Social Determinants of Health for Missouri and Illinois. Average per Capita Income, Poverty Rate Percent that did not complete high school, Unemployment Rate 2013, Rural. Rural. Statewide. Urban. Missouri. $33,430. $40, % 14.30% 17.30% 10.70% 6.70% 6.50% Illinois. $46,980. $39, % 14.60% 12.60% 12.70% 9.40% 9.10% SOURCE: Rural Assistance Center, State Guides,")
8
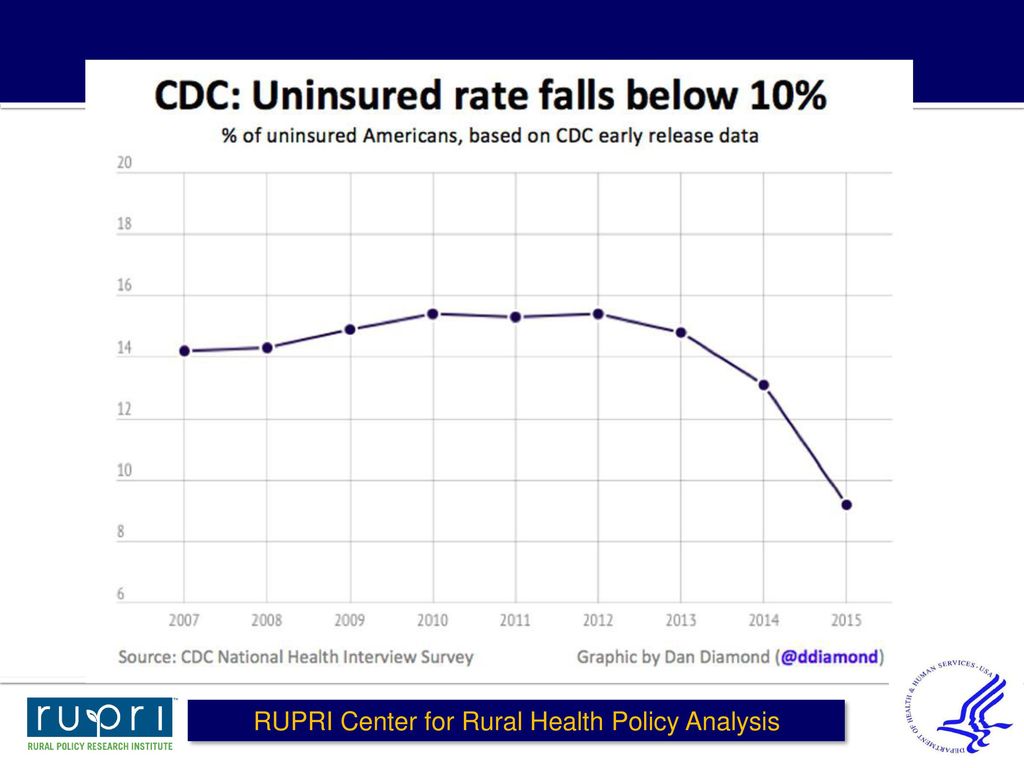
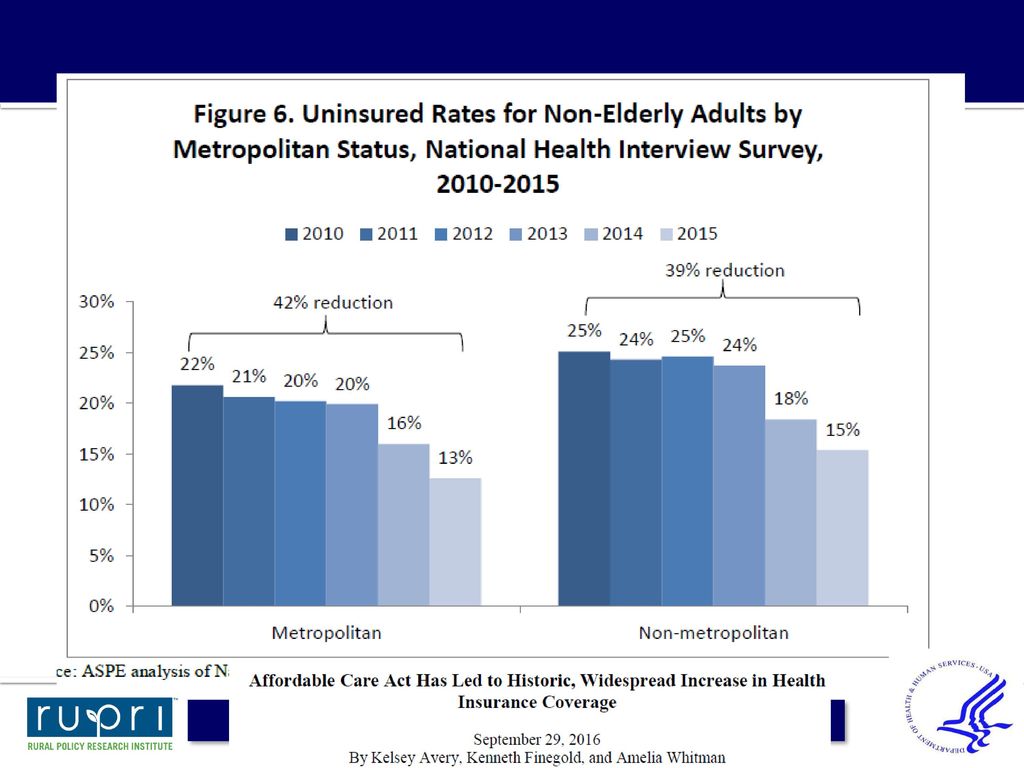
Early Impact of ACA on Coverage

11
SOURCE: Michael Karpman. 2015
SOURCE: Michael Karpman “QuickTake: Thirty-Six Percent Drop in Uninsurance Rate for Adults in Rural Areas Narrows Rural-Urban Coverage Gap,” Urban Institute, Washington DC, February 2015.

12
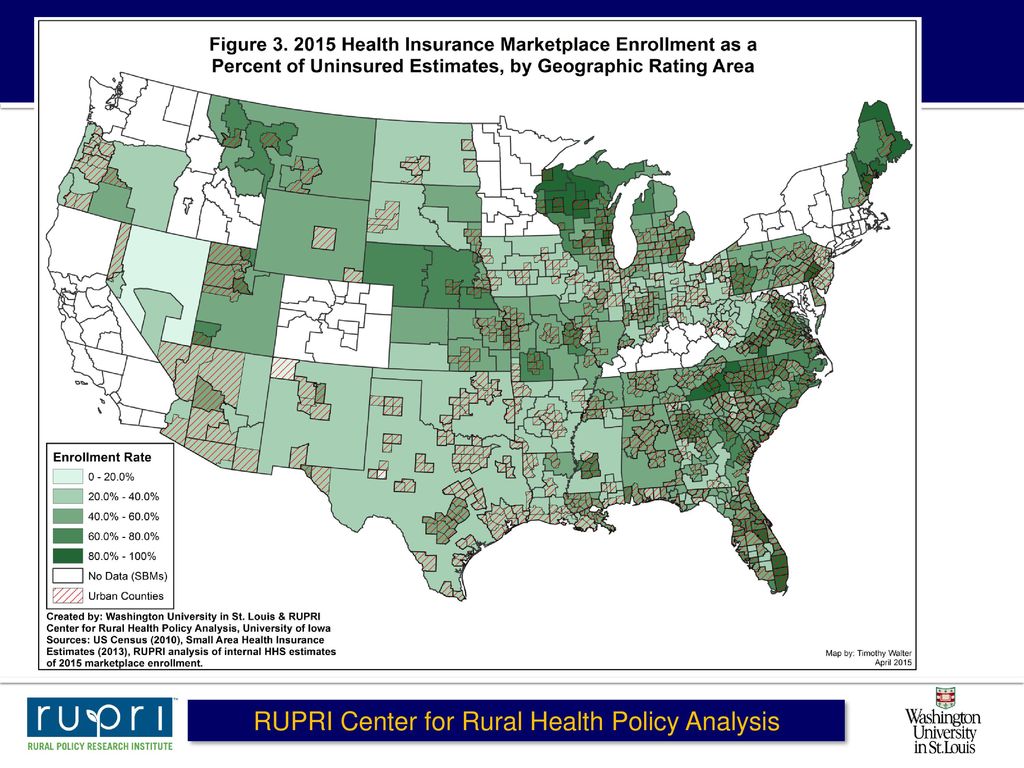
Estimated Enrollment Rates in Marketplaces, by Rating Area Population Density

13
Change in Uninsured due to ACA?
Or, even though they aren’t allowed to charge higher premiums for sicker populations, they can, in subsequent years, charge more in places where their own costs turn out to be higher – for whatver reason. Expansion states 40% drop (from 18.4% a drop of 7.4 percentage points) Non-expansion states 29% drop (from23.4%, drop of 6.9 percentage points) Source: ASPE, Uninsured Change Report, March 2015
 Non-expansion states. 29% drop (from23.4%, drop of 6.9 percentage points) Source: ASPE, Uninsured Change Report, March")
14
Medicaid Enrollment Growth
Or, even though they aren’t allowed to charge higher premiums for sicker populations, they can, in subsequent years, charge more in places where their own costs turn out to be higher – for whatver reason. Medicaid and CHIP enrollment growth (Sept Nov. 2016) 37% growth in Medicaid Expansion States 13% growth in non-expansion states 29% growth overall in all states Source: ASPE, Uninsured Change Report, March 2015
 37% growth in Medicaid Expansion States. 13% growth in non-expansion states. 29% growth overall in all states. Source: ASPE, Uninsured Change Report, March")
15
Enrolled as %Uninsured>138% FPL
Enrollment in ACA Marketplaces by Metro and Nonmetro Areas (through March 2015) All Persons Metro Areas Nonmetro Areas Enrolled Enrolled as %Uninsured>138% FPL United States 8,838,590 27.9% 7,563,301 28.8% 1,275,289 23.5% Missouri 253,432 59.7% 192,180 62.2% 61,252 53.1% Illinois 349,483 35.8% 313,242 35.2% 36,241 41.7% Kansas 96,191 48.6% 69,370 54.0% 26,821 38.6% Arkansas 65,694 27.0% 40,939 24,755 Iowa 45,167 30.4% 27,072 32.5% 18,095 27.8% SOURCE: RUPRI Center for Rural Health Policy Analysis (2015), data for states operating Federally-Facilitated Marketplaces (FFMs) only
 All Persons. Metro Areas. Nonmetro Areas. Enrolled. Enrolled as %Uninsured>138% FPL. United States. 8,838, % 7,563, % 1,275, % Missouri. 253, % 192, % 61, % Illinois. 349, % 313, % 36, % Kansas. 96, % 69, % 26, % Arkansas. 65, % 40, ,755. Iowa. 45, % 27, % 18, % SOURCE: RUPRI Center for Rural Health Policy Analysis (2015), data for states operating Federally-Facilitated Marketplaces (FFMs) only.")
17
What Challenges do Rural Areas Face, and what Difference can ACA make?

18
Life expectancy at Birth, Missouri, 2006-2010

19
Leading Causes of Rural and Urban Deaths, Missouri and Illinois
Missouri, Illinois, 2008 Rural Urban Rank Cause Number All causes 253,255 349,683 19,078 28,346 1 Heart disease 71,528 92,825 Heart Disease 4,724 7,036 2 Cancer 56,874 79,523 4,233 6,269 3 Chronic Lower Respiratory disease 15,914 Stroke 20,859 Chronic Lower Respiratory Disease 1,313 1,812 4 15,887 18,829 1,222 1,958 5 Unintentional Injuries 13,482 17,417 856 1,277 6 Alzheimer's disease 7,647 9,903 Alzheimer's Disease 646 898 7 Pneumonia and Influenza 6,941 Diabetes 9,525 561 707 8 6,701 8,645 Kidney Disease 506 865 9 Kidney disease 5,592 7,133 486 804 10 Suicide 3,437 5,150 Septicemia 256 398

20
Cancer Death and Hospitalization Rates, Missouri
The death rate for cancer is higher in rural areas, but the hospitalization rate is lower. Source: Health in Rural Missouri, Biennial Report, : Missouri Department of Health and Senior Services

21
Obesity and Smoking: Areas of Concern for Rural Missouri and Illinois
“Health in Rural Missouri”, Biennial Report, , Missouri Department of Health and Senior Services Illinois Department of Public Health, 2013 Illinois Behavioral Risk Factor Surveillance System

22
per 1,000 Residents Number of Hospital Beds by County,
Source: Missouri Department of Health and Senior Services, Bureau of Health Care Analysis and Data Dissemination, 2009 Hospital Utilization Survey

23
Primary Care Health Professional Shortage Areas in Missouri
Source: Primary Care Physicians: Rural and Urban Disparities, Missouri Hospital Association, June 2014.

24
Primary Care Physicians Per 10,000 People, March 2010
: Rural Health Plan, Missouri Department of Health and Senior Services, Office of Primary Care and Rural Health.

25
Rural Health Care Facilities in Missouri and Illinois

26
Conclusions, Implications

27
Conclusions, Implications
Enrollment data shows overall HIMs functioning as intended 8.8 million enrolled after two years in federal marketplaces (28% of potential uninsured) Significant drops in uninsured overall (>30%), including Medicaid expansion Enrollment rates higher in metro areas (in most places) Nationally, marketplace enrollment rates lower in non-metro (24%) than in metro areas (29%) In Missouri, enrollment rates lower in non-metro (53%) than in metro areas (62%) More analysis is needed to determine what is leading to these findings This shows potential for improvement: How do we increase the percentage of eligible uninsured populations enrolled in non-metro areas?
 Significant drops in uninsured overall (>30%), including Medicaid expansion. Enrollment rates higher in metro areas (in most places) Nationally, marketplace enrollment rates lower in non-metro (24%) than in metro areas (29%) In Missouri, enrollment rates lower in non-metro (53%) than in metro areas (62%) More analysis is needed to determine what is leading to these findings. This shows potential for improvement: How do we increase the percentage of eligible uninsured populations enrolled in non-metro areas")
Similar presentations