Download presentation
Presentation is loading. Please wait.

1
Baseline AVSD Echo Descriptive Analysis
Fall Work Weekend November 18, 2016 James M. Meza, MD and David M. Overman, MD (Study PI) This is first look at this – really need more involvement, want thoughts
 This is first look at this – really need more involvement, want thoughts.")
2
Measures of Inflow Physiology
Modified atrioventricular valve index (Cohen 1996 and Jegatheeswaran, 2010) Portion of AV valve allocated to each ventricular in the subxiphoid saggital ro LAO view Retrospective CHSS study – identified RV/LV inflow angle as best discriminator of unbalance (Cohen, 2013) Angle between the base of the right ventricle and left ventricle free wall using the crest of the ventricular septum as the apex of the angle
 Portion of AV valve allocated to each ventricular in the subxiphoid saggital ro LAO view. Retrospective CHSS study – identified RV/LV inflow angle as best discriminator of unbalance (Cohen, 2013) Angle between the base of the right ventricle and left ventricle free wall using the crest of the ventricular septum as the apex of the angle.")
3
Measures of Inflow Physiology
Left ventricular inflow index = Secondary inflow diameter/Primary inflow diameter (Swazst, 2011) Primary: level of left AVV annulus Secondary: color inflow jet diameter at level of papillary muscles
 Primary: level of left AVV annulus. Secondary: color inflow jet diameter at level of papillary muscles.")
4
Present Study Imaging Core Lab (ICL) has been collecting and reading echoes for 2 years Descriptive analysis of baseline diagnostic echoes

5
AVSD Cohort Inclusion criteria Exclusion criteria
Diagnosis of or referral with complete AVSD at a CHSS institution within 1st year of life Admitted to CHSS institution after January 1, 2012 Age ≤ 365 days at admission for surgery Atrioventricular and ventriculoarterial concordance Includes Tetralogy of Fallot and Double Outlet Right Ventricle Exclusion criteria Partial or Transitional AVSD Separate AV valve orifices, restrictive VSD or intact ventricular septum TAPVC or PAPVC, aortic atresia, Heterotaxy First Intervention at a non-CHSS institution

6
Study Population 328 enrolled patients,149 with echoes read (59%) Mean
Mean Std Median IQR Min-Max Demographics Age at echo 48 68 15 1-83 0-544 Height 51.6 6.3 50.0 Weight 3.6 1.2 3.3 BSA 0.2 0.05

7
Clinical characteristics
Frequency Complete AVSD (unrestrictive VSD) 100% AV concordance VA concordance Normal pulmonary venous connection 99.5% (193/194) Normal systemic venous connection Additional Diagnosis Tetralogy of Fallot 7% (13/194) Systemic venous anomalies 3% (5/193) LSVC to CS 7% (13/185) LSVC Unroofed to LA 0% Bilateral SVCs 6% (11/183) Interrupted IVC to RSVC/LSVC
 100% AV concordance. VA concordance. Normal pulmonary venous connection. 99.5% (193/194) Normal systemic venous connection. Additional Diagnosis. Tetralogy of Fallot. 7% (13/194) Systemic venous anomalies. 3% (5/193) LSVC to CS. 7% (13/185) LSVC Unroofed to LA. 0% Bilateral SVCs. 6% (11/183) Interrupted IVC to RSVC/LSVC.")
8
Echo Review Protocol Single reviewer – Cheryl Fakhoury 111 parameters

9
Atrial and Ventricular Septae
Frequency Malalignment of atrial and ventricular septum 15% (25/186) Right (double outlet LA) 8% (2/25%) Left (double outlet LA) 92% (23/25) Ostium primum ASD 99.5% (193/194) Primum ASD restrictive 2% (4/192) Mean Std Median IQR Min-Max ASD size 0.7 0.4 0.6 Inlet VSD size: From PSSAx (cm) 0.2 Inlet VSD size: From Apical 4 (cm)
 Right (double outlet LA) 8% (2/25%) Left (double outlet LA) 92% (23/25) Ostium primum ASD. 99.5% (193/194) Primum ASD restrictive. 2% (4/192) Mean. Std. Median. IQR. Min-Max. ASD size Inlet VSD size: From PSSAx (cm) Inlet VSD size: From Apical 4 (cm)")
10
Common AV Valve Mean Std Median IQR Min-Max Mural leaflet length 1.4
Mean Std Median IQR Min-Max Mural leaflet length 1.4 0.4 1.3 Mural leaflet width 0.9 0.2 Total CAVV diameter 2.4 RAVV area 1.7 0.7 1.6 LAVV area 0.6 1.2 Total area 3.1 1.1 3.0 2D measurement RAVV (apical 4) (cm) 0.3 Color inflow diameter at annulus RAVV (cm) 1.5 Color inflow diameter at mid cavity or at smallest inflow portion RAVV(cm) 0.8 2D measurement LAVV (apical 4) (cm): Color inflow diameter at annulus (cm) Color inflow diameter at mid cavity or at smallest inflow portion (cm) Distance between two papillary muscles: (cm)
 (cm) Color inflow diameter at annulus RAVV (cm) Color inflow diameter at mid cavity or at smallest inflow portion RAVV(cm) D measurement LAVV (apical 4) (cm): Color inflow diameter at annulus (cm) Color inflow diameter at mid cavity or at smallest inflow portion (cm) Distance between two papillary muscles: (cm)")
11
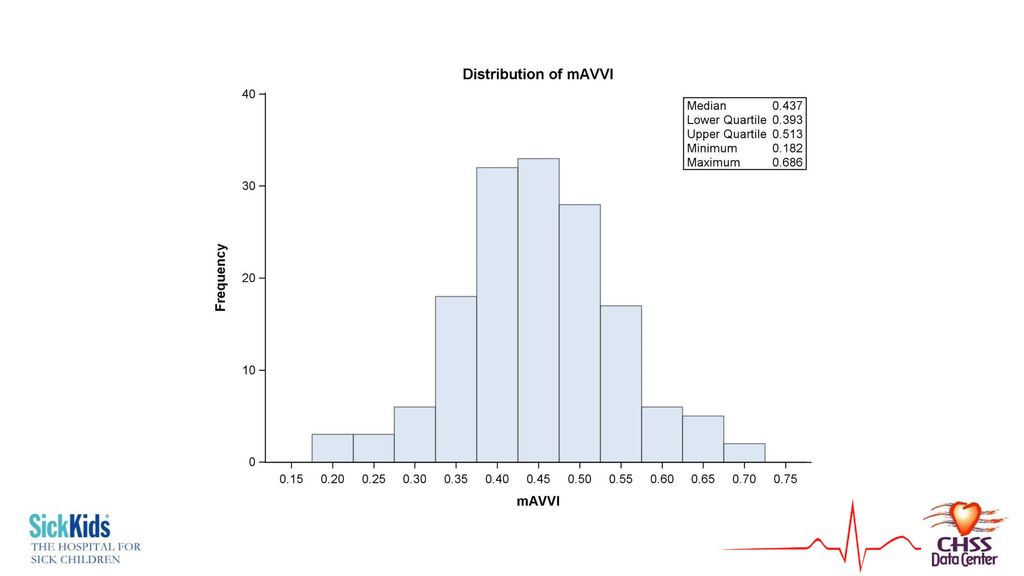
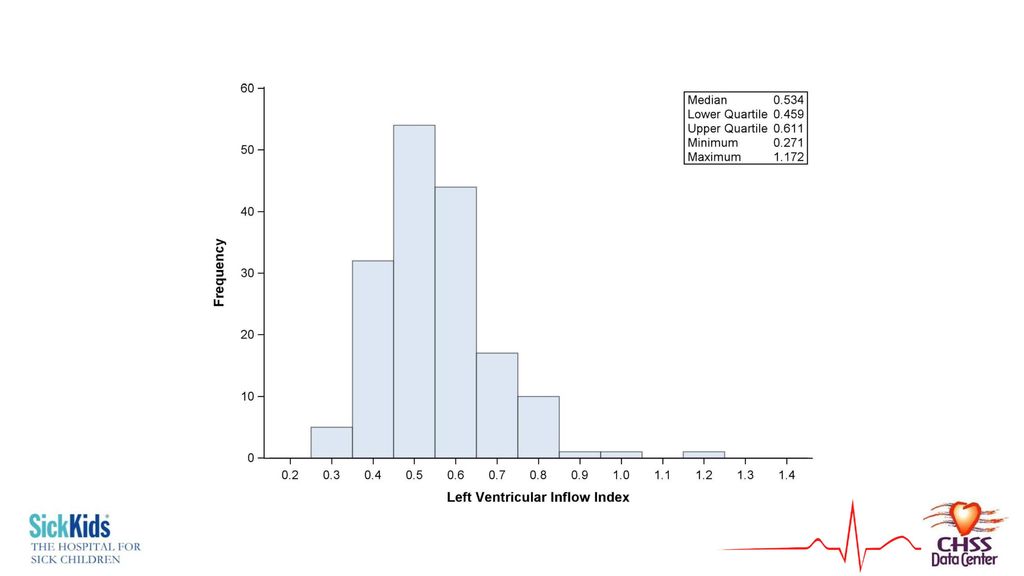
Inflow Characteristics
Mean Std Median IQR Min-Max mAVVI 0.45 0.10 0.44 RV inflow – LV inflow angle 91.0 15.8 89.0 Left ventricular inflow index 0.5 0.1 Frequency Right-dominant 22% (42/194) Balanced 53% (108/194) Left dominant 5% (9/194) Unable to determine (no mAVVI) 21% (41/194)
 Balanced. 53% (108/194) Left dominant. 5% (9/194) Unable to determine (no mAVVI) 21% (41/194)")
14
RV/LV inflow angle (degrees) 145+12 113+9 81+9
")
15
Frequency Common AV Valve Regurgitation Trivial 6% (11/194) Mild 68% (132/194) Moderate 22% (42/194) Severe 5% (9/194) Left AV Valve regurgitation None 11% (22/193) 18% (35/193) 62% (120/193) 8% (15/193) 1% (1/193) Right AV Valve regurgitation 2% (4/193) 30% (57/193) 50% (97/193) 15% (29/193) 3% (6/193) Rastelli Type A 79% (66/84) B 2% (2/84) C 19% (16/84) Papillary muscle abnormality 32% (56/189) Too close 30% (17/56) One hypoplastic 70% (39/56) Parachute 0% Double orifice LAVV 0.6% (1/160)
 Severe. 5% (9/194) Left AV Valve regurgitation. None. 11% (22/193) 18% (35/193) 62% (120/193) 8% (15/193) 1% (1/193) Right AV Valve regurgitation. 2% (4/193) 30% (57/193) 50% (97/193) 15% (29/193) 3% (6/193) Rastelli Type. A. 79% (66/84) B. 2% (2/84) C. 19% (16/84) Papillary muscle abnormality. 32% (56/189) Too close. 30% (17/56) One hypoplastic. 70% (39/56) Parachute. 0% Double orifice LAVV. 0.6% (1/160)")
16
Right Ventricle Mean Std Median IQR Min-Max
RV Area in End - Diastole (4 chamber view) (cm2) 4.3 1.5 4.0 RV Area in End - Systole (4 chamber view) (cm2) 2.8 1.0 2.7 Right Ventricle Fractional Area Change (Calculated field) (%) 35.3 7.7 34.5 0-75.9 RV length From AV Valve to apex (at end of QRS complex) (cm) 0.5 RV width (from the crest of the septum- RV side- to the free wall) (cm) 1.6 0.4 Frequency RV hypoplasia None 88% (170/194) Trivial 3% (6/194) Mild 4% (7/194) Moderate 4% (8/194) Severe 1% (3/194) RV systolic dysfunction 97% (188/193) 2% (4/193) 1% (1/193) Apex-forming RV 93% (179/192)
 (cm2) RV Area in End - Systole (4 chamber view) (cm2) Right Ventricle Fractional Area Change (Calculated field) (%) RV length From AV Valve to apex (at end of QRS complex) (cm) RV width (from the crest of the septum- RV side- to the free wall) (cm) Frequency RV hypoplasia. None. 88% (170/194) Trivial. 3% (6/194) Mild. 4% (7/194) Moderate. 4% (8/194) Severe. 1% (3/194) RV systolic dysfunction. 97% (188/193) 2% (4/193) 1% (1/193) Apex-forming RV. 93% (179/192)")
17
Pulmonic Valve Mean Std Median IQR Min-Max PV Annulus in systole (cm)
1.0 0.2 Frequency PV stenosis None 90% (170/194) Trivial 0.5% (1/194) Mild 4% (7/194) Moderate 4% (8/194) Severe 1.5% (3/194) PV regurgitation 39% (75/194) 47% (91/194) 14% (28/194)
 Trivial. 0.5% (1/194) Mild. 4% (7/194) Moderate. 4% (8/194) Severe. 1.5% (3/194) PV regurgitation. 39% (75/194) 47% (91/194) 14% (28/194)")
18
RVOT Mean Std Median IQR Min-Max Peak gradient (mmHg) 36.5 27.4 27.2
Mean gradient (mmHg) 22.1 17.8 18.7 Frequency RVOT Obstruction 9% (16/183) Subvalvar 44% (7/16) Valvar 13% (2/16) Supravalvar 6% (1/16) Diffuse 38% (6/16)
 Frequency RVOT Obstruction. 9% (16/183) Subvalvar. 44% (7/16) Valvar. 13% (2/16) Supravalvar. 6% (1/16) Diffuse. 38% (6/16)")
19
Left Ventricle Frequency LV hypoplasia None 90% (174/194) Trivial
None 90% (174/194) Trivial 0.5% (1/194) Mild 3% (6/194) Moderate Severe 3.5% (7/194) Apex-forming LV 94% (181/192) LV dysfunction Systolic 95% (183/192) 3% (6/192) 1% (2/192) 1% (1/192)
 Trivial. 0.5% (1/194) Mild. 3% (6/194) Moderate. Severe. 3.5% (7/194) Apex-forming LV. 94% (181/192) LV dysfunction Systolic. 95% (183/192) 3% (6/192) 1% (2/192) 1% (1/192)")
20
Left Ventricle Mean Std Median IQR Min-Max LVEDD (cm) 1.8 0.5 1.6-2.1
LVESD (cm) 1.1 0.3 LVEF (%) 71.1 9.3 72.0 LV area in End-Diastole (4 chamber view): (cm2) 4.4 1.7 LV area in End-Systole (4 chamber view): (cm2) 2.4 0.9 2.3 Left Ventricle Fractional Area Change (calculated field): (%) 43.3 7.5 43.5 LV length from AVV to apex (at end of QRS complex) (cm) 2.9 LV width (from crest of septum- LV side- to free wall) (cm) 1.6 0.4
 LVEF (%) LV area in End-Diastole (4 chamber view): (cm2) LV area in End-Systole (4 chamber view): (cm2) Left Ventricle Fractional Area Change (calculated field): (%) LV length from AVV to apex (at end of QRS complex) (cm) LV width (from crest of septum- LV side- to free wall) (cm)")
21
LVOT Frequency Left Ventricular Outflow Tract Obstruction 3% (5/193)
LVOTO level of stenosis Sub-valvar 80% (4/5) Valvar 20% (1/5) LVOTO Type of Subvalvar Stenosis Tunnel 100% LVOTO Type of Supravalvar Stenosis Discrete 25% Diffuse 75% Mean Std Median IQR Min-Max Smallest LVOT diameter in systole (cm) 0.7 0.2 Peak gradient (mmHg) 5.0 2.2 4.8 Mean gradient (mmHg) 2.3 1.3
 Valvar. 20% (1/5) LVOTO Type of Subvalvar Stenosis. Tunnel. 100% LVOTO Type of Supravalvar Stenosis. Discrete. 25% Diffuse. 75% Mean. Std. Median. IQR. Min-Max. Smallest LVOT diameter in systole (cm) Peak gradient (mmHg) Mean gradient (mmHg)")
22
Aortic Valve Mean Std Median IQR Min-Max
Aortic Annulus in systole (cm) 0.8 0.2 Aortic root in systole (cm) 1.0 1.1 Sinotubular junction in systole (cm)
 Aortic root in systole (cm) Sinotubular junction in systole (cm)")
23
Aortic Valve Frequency Aortic Valve Thickening None 92% (178/193)
None 92% (178/193) Trivial 2% (4/193) Mild 3% (6/193) Moderate 3% (5/193) Number of Leaflets Bi 6% (9/148) Tri 94% (139/148) Stenosis 96% (184/191) 2% (3/191) 2% (4/191) Regurgitation 67% (129/194) 29% (57/194) 4% (8/194)
 Trivial. 2% (4/193) Mild. 3% (6/193) Moderate. 3% (5/193) Number of Leaflets. Bi. 6% (9/148) Tri. 94% (139/148) Stenosis. 96% (184/191) 2% (3/191) 2% (4/191) Regurgitation. 67% (129/194) 29% (57/194) 4% (8/194)")
24
Aorta Mean Std Median IQR Min-Max
Ascending Aorta (measured from parasternal LA view in systole, just above the ST junction): (cm) 0.8 0.1 0.9 Transverse Arch (cm) 0.5 Isthmus (cm) 0.4 Descending aorta (cm) 0.6 0.03 Peak Arch gradient (mmHg) 11.1 10.0 6.8 Mean Arch gradient (mmHg) 6.1 5.6 3.7
: (cm) Transverse Arch (cm) Isthmus (cm) Descending aorta (cm) Peak Arch gradient (mmHg) Mean Arch gradient (mmHg)")
25
Aorta Frequency Coarctation present 18% (29/158)
Location of coarctation Transverse 7% (2/27) Isthmus 93% (25/27) Interrupted Arch 0% Flow direction in ascending arch: Antegrade 100% Flow direction in transverse arch: 95% (181/190) Retrograde 1% (2/190) Bidirectional 4% (7/190)
 Isthmus. 93% (25/27) Interrupted Arch. 0% Flow direction in ascending arch: Antegrade. 100% Flow direction in transverse arch: 95% (181/190) Retrograde. 1% (2/190) Bidirectional. 4% (7/190)")
26
Ductus Arteriosus Frequency Ductus patent 61% (116/189)
Ductal flow restrictive 55% (62/113) Ductal flow in systole Left to right 3% (3/98) Right to left 97% (95/98) Ductal flow in diastole 99% (114/115) 1% (1/115)
 Ductal flow in systole. Left to right. 3% (3/98) Right to left. 97% (95/98) Ductal flow in diastole. 99% (114/115) 1% (1/115)")
27
Correlating inflow physiology and ventricular geometry

28
Correlations of mAVVI with other indices of inflow physiology
Pearson Correlation Coefficient P-value LVII 0.28 0.001 RV/LV inflow angle 0.12 0.13

29
Correlations – mAVVI and measures of ventricular geometry
Pearson Correlation Coefficient P-value Color inflow diameter at RAVV annulus -0.29 0.001 Color inflow diameter at LAVV annulus 0.41 < RV end diastolic area -0.31 0.0001 LV end diastolic area 0.43

30
Correlations – RV/LV inflow angle and measures of ventricular geometry
Pearson Correlation Coefficient P-value Color inflow diameter at RAVV annulus -0.40 < Color inflow diameter at LAVV annulus -0.36 RV end diastolic area 0.08 0.26 LV end diastolic area 0.12 0.11

31
Correlations – LVII and measures of ventricular geometry
Pearson Correlation Coefficient P-value Color inflow diameter at RAVV annulus -0.26 0.002 RV end diastolic area -0.10 0.22 LV end diastolic area 0.16 0.04

32
Next steps Exploring impact of septal angulation on ventricular geometry Exploring mural leaflet sizes and ventricular geometry Abnormalities of LAVV apparatus and ventricular geometry Paplliary muscle abnormalities

33
THANK YOU

Similar presentations