Download presentation
Presentation is loading. Please wait.

1
Comparative analysis on wages
PERC Economists network meeting “Wage policy forum” May, Chisinau (Moldova) Comparative analysis on wages in the SEE/NIS Bruno S. Sergi University of Messina
 Comparative analysis on wages. in the SEE/NIS. Bruno S. Sergi. University of Messina.")
2
Inequality in Eastern Europe and CIS transitional economies
Inequality in Eastern Europe and CIS transitional economies. It comes from the past In Eastern Europe, changes in the distribution of income and wealth associated with the restoration of market economy, privatization of state assets. The political implications are country specific, as the countries are diverse in terms of size, level of development, historical background, and social and political structure. After drastic increase in income equality during the market liberalization period, some Eastern Europe nations have improved or maintained the same level of the Gini coefficient since 2000 due to economic growth, effective fiscal redistribution for social service.

3
What has occurred in the past
What has occurred in the past? The drop of real wages during the transition to market economy

4
Latest Gini 2012 Bulgaria 36.01 Poland 32.39 Romania 27.33 Czech 26.13 Hungary 30.55 Slovakia 26.58 Slovenia 25.59 Estonia 33.15 Latvia 35.48 Lithuania 35.15 Belarus 26.01 Moldova 29.16 Russia 41.59 Ukraine 24.74 Kazakhstan 27.43 Kyrgyz 27.35 Turkmenistan 40.77 (1998)
")
5
Structural Unemployment after the Transition Economics
Many eastern Europe nations inherited a relative large human capital stock from the socialist period, due to relative large investment and development in all stages of education. The increase in inequality resulted from increase of unemployment due to underinvestment in human capital.

6
Labor productivity in Eastern Europe, 1996–2015

7
Working age population growth

8
Current Trend in Central and Eastern Europe (Nov 2016, IMF)
Economic growth remains solid in much of Central, Eastern. In Russia, the pace of economic contraction has moderated, as the economy appears to have adjusted to lower oil prices and the sanctions shock. Other CIS economies are gradually exiting from recessions on improved external demand.

9
Current Trend in Central and Eastern Europe (Nov 2016, IMF)
")
10
Unemployment is reaching pre-crisis lows, wages have been growing at a strong pace for some time, and the current account balances have begun to deteriorate again.

11
WAGES SOURCE: ILO database

12
And today? Let’s kick off our discussion!
SEE.

16
Minimum and average wage growth
Minimum wages since 2012 have been rising faster than average wages in most CESEE countries. The pace of increase has been sharp particularly in Turkey, and some Baltics and SEE-EU countries. Based on limited available data, about 10-20% of workers earn the minimum wage in CESEE. Minimum wage hikes could contribute to overall wage growth directly and indirectly through spillovers. About 1⁄4 of average wage growth in CESEE countries over is associated with minimum wage developments. SEE.

18
Gross average monthly wages

19
Gross average monthly wages

20
Wages,

21
Wages,

22
Losers and winners

23
Losers and winners Turkey -18,31 Greece -16,33 Hungary -1,98 oecd 4,50
Slovenia 17,56 Finland 17,66 Poland 25,73 Czechia 27,96 Montenegro 31,75 Croatia 31,86 Slovakia 36,75 Bosnia and Herzegovina 44,21 Serbia 64,22 The former Yugoslav Republic of Macedonia 67,02 Russian Federation 84,46 Albania 89,31 Ukraine 90,08 Belarus 93,61 Lithuania 95,73 Moldova, Republic of 146,41 Romania 149,47 Latvia 152,87 Armenia 239,54 Georgia 252,22

24
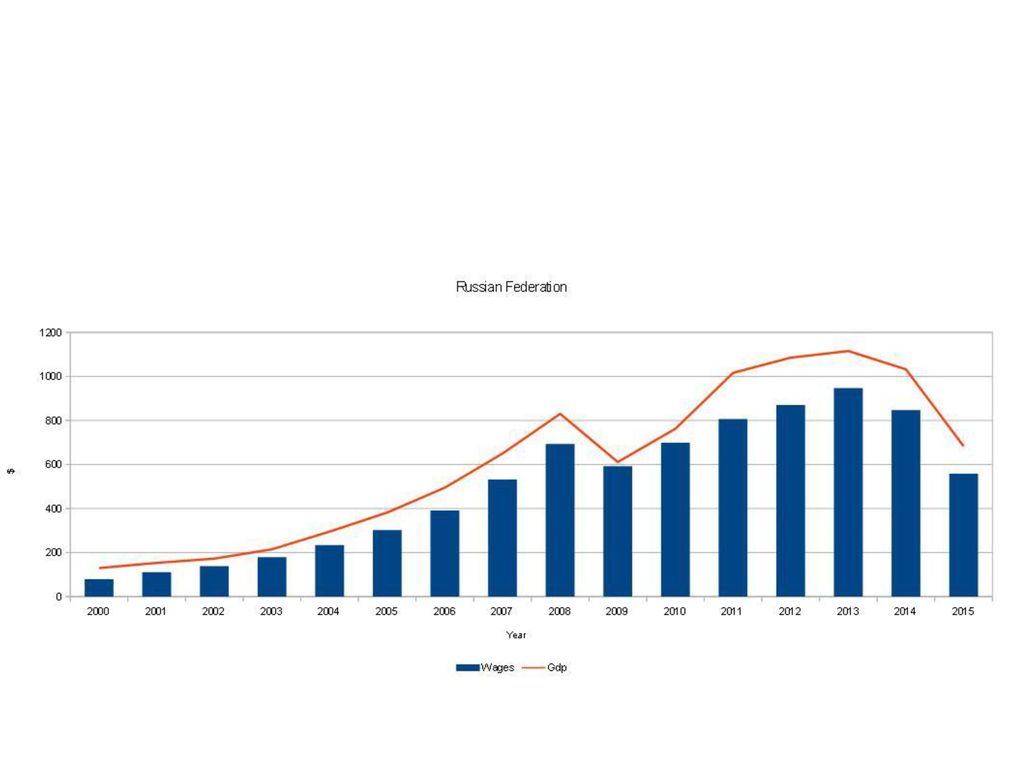
Wages vs GDP and Productivity
Note: wages in US$ at current Exchange Rates

40
The role of economic growth and productivity
There are 4 factors o f production that influence economic growth within a country: Natural Resources available Investment in Human Capital Investment in Capital Goods Entrepreneurship

41
https://www. conference-board. org/retrievefile. cfm

42
Growth of Labor Productivity, Persons Employed and Real GDP for Major Emerging Economies, 1999-2016

43
Trend growth of Labor productivity (output per person) using HP filter, Major Regions, 1971-2015
 using HP filter, Major Regions,")
44
Growth of Labor Productivity and TFP, Major Regions, 1999-2015

45
How will important variables change in the region?
Looking forward: How will important variables change in the region? GDP structure, growth, and inflation.

46
Albania

47
Bosnia and Herzegovina

48
Bulgaria

49
Hungary

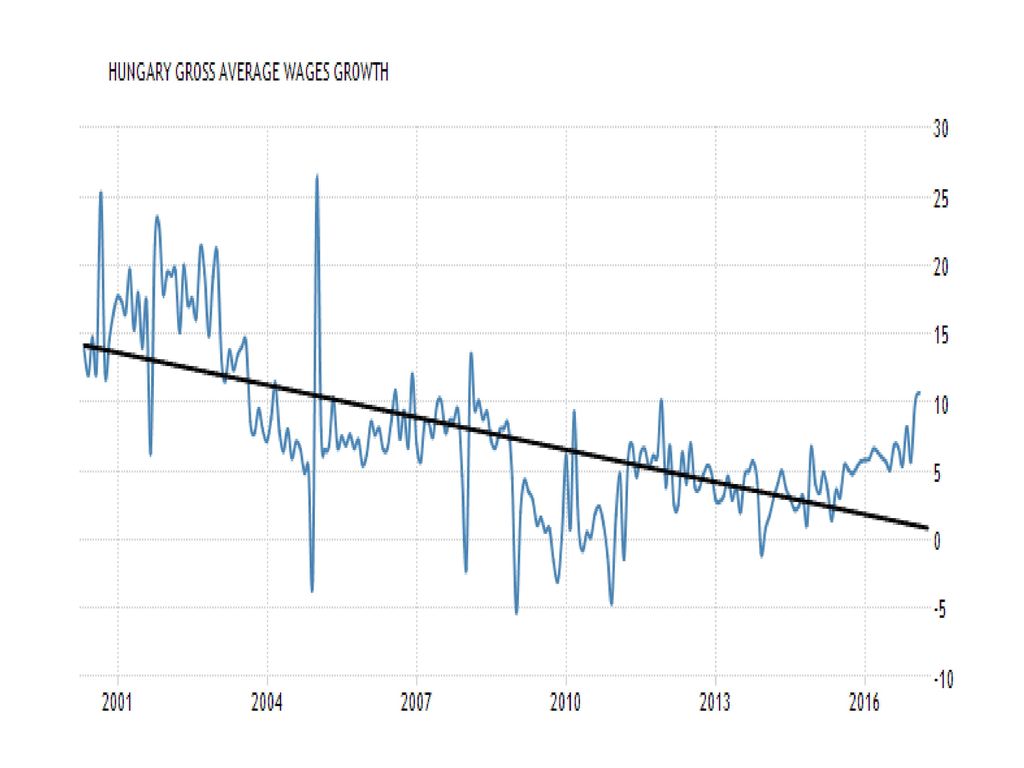
50
Macedonia

51
Moldova

52
Montenegro

53
Romania

54
Serbia

55
Ukraine

56
Europe & Central Asia

57
GDP, unemployment and inflation forecast

58
GDP forecast

59
Unemployment forecast

60
GDP forecast

61
GDP

62
GDP

63
CPI inflation

64
CPI Inflation

65
CPI inflation

66
Unemployment

67
Unemployment

68
Unemployment

69
Countries’ experience

71
Bulgaria

72
Bulgaria

73
Bulgaria average monthly wages in manufacturing

74
Bulgaria wages low skilled jobs

75
Croatia

76
Croatia

77
Hungary

78
Hungary

83
Macedonia

84
Macedonia real wage growth

86
Moldova average monthly wages in manufacturing

88
Romania average monthly gross wages in manufacturing

89
Ukraine

94
Hints for discussion Any explicit, numerical goal for wages increase?
High and low skilled jobs ….and their wage policies? Note different domestic economic and productive realities. Towards sectoral-based wage increase policies?

95
Thank you

Similar presentations


 2.UNEMPLOYMENT 3.INFLATION 4.INCOME PER CAPITA 5.BALANCE OF PAYMENTS: EXPORTS.>")


