Download presentation
Presentation is loading. Please wait.

1
Light Microscopy Research Group Robert F. Stack, Richard W. Cole Wadsworth Center / NYSDOH Albany, N.Y.

2
starting in early 2009, the LMRG formalized a list of study participants and sent out test materials (Chroma slides and Tetraspeck bead slides) along with the proposed procedures that had been formulated by the research group ascertain the current state of light microscope performance using simple, efficient & robust tests three imaged-based test procedures LASER stability, field illumination & co-registration define & improve relative testing standards that will assist core managers and users in the maintaining their microscopes for optimal operation conduct a worldwide research study on instrument performance emphasis was on performance standards All microscope brands & types have their strengths & weaknesses – the goal is Cross-platform standards that will improve the validity of quantitative measurements in light microscopy Purpose of Phase One of the Quality Assurance study
 along with the proposed procedures that had been formulated by the research group ascertain the current state of light microscope performance using simple, efficient & robust tests three imaged-based test procedures LASER stability, field illumination & co-registration define & improve relative testing standards that will assist core managers and users in the maintaining their microscopes for optimal operation conduct a worldwide research study on instrument performance emphasis was on performance standards All microscope brands & types have their strengths & weaknesses – the goal is Cross-platform standards that will improve the validity of quantitative measurements in light microscopy Purpose of Phase One of the Quality Assurance study")
3
History of performance standards / Light Microscopy current state of performance standards in light microscopy vendor initiated – none / acceptance specs only NIST developed -- none imaging community at large – lab specific Why ? – until the last 5-10 yrs, simply observing a specimen was sufficient; recent advances in light microscopes necessitate traceable standards & procedures development of performance standards (case study: mass spectrometry) started with minimal vendor-based tuning & MW calibration compounds NIST : NIST Standard Reference Data Program – mass spectra for over 15,000 compounds NIST Standard Reference Materials – performance standards & mixtures available for LC/MS, GC/MS, ICP-MS & Isotope-ratio MS The MS community: lab-specific acceptance criteria now common place proteomics data acceptance criteria now routine
 started with minimal vendor-based tuning & MW calibration compounds NIST : NIST Standard Reference Data Program – mass spectra for over 15,000 compounds NIST Standard Reference Materials – performance standards & mixtures available for LC/MS, GC/MS, ICP-MS & Isotope-ratio MS The MS community: lab-specific acceptance criteria now common place proteomics data acceptance criteria now routine.")
4
Quality and standards: Making bioimaging ‘measure up’ Susan M. Reiss BioOptics World, Jan/Feb 2010, Vol.3 No.1, p.14-18 Does anyone care ??? NIST, FDA, Congress & NIH Overall Goal – the creation of a range of imaging parameters traceable to standard references NIST – create traceable references with the goal of moving medical imaging & lab testing from an art to a science FDA – device & drug approval processes ensure manufacturers systems are reliable and drugs are safe & efficacious Congress – provide the financial support for standards research What’s currently underway and or recently completed : NIST – development of ‘phantoms’ for CT, MRI &, standard protocols & analysis algorithms FDA – potential changes in drug & device approval process new imaging technologies will likely be subject to more rigorous quality control standards regarding intended use increased imaging precision could lead to dramatically shortened clinical trials Congress – since FY2007, 4 million $$ has been provided with an additional 3.5 million $$ requested by NIST subcommittee hearings are ongoing regarding standards development Goal is to reduce Health care costs via savings in lower diagnostic imaging costs NIH – Realizes the need for and supports the “core” model – 40% of S10 grants funded in FY2009 were for imaging in general; 13% were for confocal microscopes “Having a core laboratory that had not just all the instrumentation but real expertise accelerated our research in ways that would not have happened otherwise” ( R.P.Lifton / Yale) Access sparks action Lila Guterman NCRR Reporter, Winter 2010, p.4-8
 Access sparks action Lila Guterman NCRR Reporter, Winter 2010, p.4-8.")
5
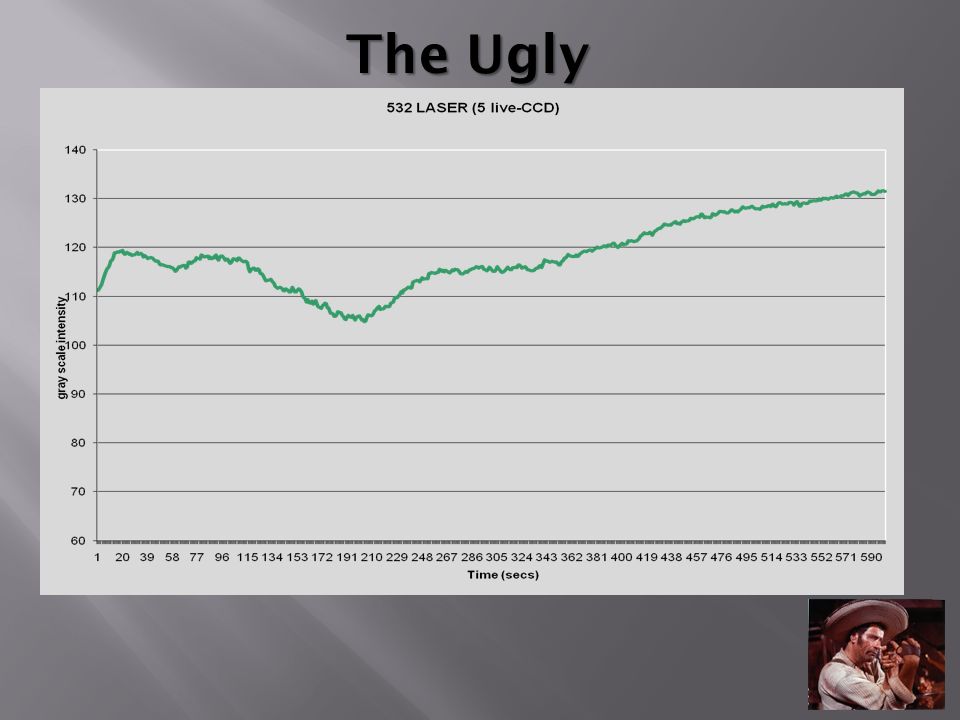
LASER, stage, PMT stability: Purpose: Measure LASER brightness/ fluctuation and PMT sensitivity/fluctuation over time. Protocol: Warm up LASERs for one hour. Use the appropriate Chroma slide and LASER combination. Note: several different LASER lines may work with one slide. The red slide works well for most LASERs. With a 10x or 20x (low NA) lens focus a surface scratch, then focus down ~20um Set up acquisition such that: Gain and offset should be set so that no PMT is saturated. The mean value should be ~150 (out of 255 gray levels). These values as well as LASER power will vary for each LASER used. Collect images every 30 sec for 3 hours. Use 1 line averages per frame. Use sequential scan to collect as many LASER lines as possible, i.e. 1 LASER line/ PMT Collect images every 0.5 sec for 5 min., one wavelength at a time and scan faster if necessary. At the end of test, shift the slide ~1/2 of the field of view and collect another image. Measure the intensity across the field to check for photobleaching. Analysis: Calculate: 1. mean brightness should be ~150 2. standard deviation 3. the range in brightness (highest value-lowest value) 4. longest time the LASER stayed within 10% & 3% of the mean value for 3hr & 5 min test respectively. http://www.abrf.org/index.cfm/group.show/LightMicroscopyResearchGroup.54.htm
 lens focus a surface scratch, then focus down ~20um Set up acquisition such that: Gain and offset should be set so that no PMT is saturated. The mean value should be ~150 (out of 255 gray levels). These values as well as LASER power will vary for each LASER used. Collect images every 30 sec for 3 hours. Use 1 line averages per frame. Use sequential scan to collect as many LASER lines as possible, i.e. 1 LASER line/ PMT Collect images every 0.5 sec for 5 min., one wavelength at a time and scan faster if necessary. At the end of test, shift the slide ~1/2 of the field of view and collect another image. Measure the intensity across the field to check for photobleaching. Analysis: Calculate: 1. mean brightness should be ~ standard deviation 3. the range in brightness (highest value-lowest value) 4. longest time the LASER stayed within 10% & 3% of the mean value for 3hr & 5 min test respectively.")
7
The Good MP = multi-photon LASER with dichroic splitter for red & green channels

8
The Good

9
The Bad

11
The Ugly

13
Field illumination: Purpose: Measure uniformity of illumination across the entire scan field Protocol: Warm up LASERs for one hour. Use the 488 or 543/561 LASER combination for green/orange slide from Chroma slide (cover-slipped area) Collect scan such that the intensity is near 150 / averaging OK, zoom @ manufacturers specification, (0.7 - 1), using as many lens as possible. Use sufficient LASER power so that the gain on the PMT is ~ ½ the maximum Analysis: Using entire image: perform a line scan profile diagonally and horizontally across the image to check for drop off near the edges. The typical 1X zoom variations are 10% in horizontal and 20% in diagonal. http://www.abrf.org/index.cfm/group.show/LightMicroscopyResearchGroup.54.htm
 Collect scan such that the intensity is near 150 / averaging OK, manufacturers specification, ( ), using as many lens as possible. Use sufficient LASER power so that the gain on the PMT is ~ ½ the maximum Analysis: Using entire image: perform a line scan profile diagonally and horizontally across the image to check for drop off near the edges. The typical 1X zoom variations are 10% in horizontal and 20% in diagonal.")
14
Zoom = 1 Zoom = 1.25 Images of fluorescent test slide (20X) & results of line scans
 & results of line scans")
15
The Good Modern light microscopy is a Quantitative technique; it is critical to know whether measurement variations are due to uneven photon strength

16
The Bad 20x objective zoom=1 uneven illumination at corners and edges

17
The Ugly

18
PMT co-registration: Purpose: Determine to what extent images of an object (bead) collected with different PMTs will co-register/superimpose to each other Protocol: Bead slide: (will be provided) 4.0 µm Tetraspeck beads (B, G, O & dark R) o high NA (>1.2) lens, i.e., 40X or higher o Collect such that the pixel size is half the resolution of the lens o Zoom near 10 will be needed o use a standard three or four color protocol. Collect a Z series using sequential scans of three or more PMTs Do not forget to use the NDD for MP scopes. Analysis: Using a line scan function, plot the intensities across the bead for each slice in the stack. The brightest slice is the “most in focus” This should be the same Z position for all PMTs. Using the ImageJ measurement function, determine the center of mass for the “most in focus” slice for all the PMTs. Determine the displacement among the PMT’s. Performing this on >1 bead will help to separate aberrant beads Single beads should be “cropped out” for the measurements. http://www.abrf.org/index.cfm/group.show/LightMicroscopyResearchGroup.54.htm

19
“most in focus” slices from each PMT & center of mass values (µM) for top most bead
 for top most bead")
20
The Good -- No lateral shift a/o width differences (good lateral & axial co-registration )
")
21
The Bad -- lateral co-registration good -- axial (Z) co-registration bad
 co-registration bad")
22
The Ugly -- lateral co-registration bad (center of mass = *) -- axial (Z) co-registration bad (note size difference)
 -- axial (Z) co-registration bad (note size difference)")
23
Phase Two / Future directions detailed data analysis in conjunction with a statistician publication detailing study findings & recommendations develop standards (procedures & samples) that provide broad applicability and are widely accepted by the greater imaging community identify specimens with structure that are excitable over multiple wavelengths interface with NIST traceable reference standards are their area of expertise
 that provide broad applicability and are widely accepted by the greater imaging community identify specimens with structure that are excitable over multiple wavelengths interface with NIST traceable reference standards are their area of expertise")
24
Light Microscopy Research Group Richard ColeRichard Cole (Chair) - Wadsworth Center / NYSDOH Carol J BaylesCarol J Bayles - Cornell University Karen MartinKaren Martin - West Virginia University Cynthia OpanskyCynthia Opansky – Blood Center of Wisconsin Katherine SchulzKatherine Schulz - Blood Center of Wisconsin Robert F. StackRobert F. Stack - Wadsworth Center / NYSDOH Pamela Scott AdamsPamela Scott Adams - (Ad hoc) (EB Liaison) - Trudeau Institute Anne-Marie Girard – Oregon State University * We would also like to thank the ABRF for their financial support and commitment to this project *
 (EB Liaison) - Trudeau Institute Anne-Marie Girard – Oregon State University * We would also like to thank the ABRF for their financial support and commitment to this project *.")
25
To all of the dedicated researchers who took time out of their busy schedules to participate in this study – we received data from 23 PIs across 7 countries ! CHEERS !!

Similar presentations


 Orientation: Microscopy Venu Polineni Research Associate, SCIF University of California, Merced Phone: (559) 253-3068.>")


 Axial resolution (mirror) Chromatic aberration (1 u beads, mirror) Laser power.>")


