Download presentation
Presentation is loading. Please wait.

1
Intraseasonal to interannual variability of the Brazil Current transport measured at 34.5°S M. P. Chidichimo* 1, A. R. Piola 1, C. S. Meinen 3, E. Campos 4, S. Garzoli 3,5, S. Speich 6, R. Perez 3,5, S. Dong 3,5, R. Matano 7, V. Combes 7 1 Consejo Nacional de Investigaciones Científicas y Técnicas (CONICET), Servicio de Hidrografía Naval, Universidad de Buenos Aires, Argentina 3 NOAA/AOML, Physical Oceanography Division, Miami, Florida, USA 4 Oceanographic Institute, University of Sao Paulo, Brazil 5 CIMAS, University of Miami, Miami, Florida, USA 6 ENS-Laboratoire de Météorologie Dynamique, Paris, France. 7 Oregon State University, Corvallis, Oregon, USA Nov. 2015, Aquarius Meeting, Buenos Aires, Argentina *mpchidichimo@hidro.gov.ar
, Servicio de Hidrografía Naval, Universidad de Buenos Aires, Argentina 3 NOAA/AOML, Physical Oceanography Division, Miami, Florida, USA 4 Oceanographic Institute, University of Sao Paulo, Brazil 5 CIMAS, University of Miami, Miami, Florida, USA 6 ENS-Laboratoire de Météorologie Dynamique, Paris, France. 7 Oregon State University, Corvallis, Oregon, USA Nov. 2015, Aquarius Meeting, Buenos Aires, Argentina")
2
●The Brazil Current is a key element of the South Atlantic circulation, as it advects warm water from subtropical to subpolar regions carrying components of Atlantic Meridional Overturning Circulation variability. ●In the South Atlantic, IES have been previously utilized to analize the variability of the Brazil Malvinas Confluence (Garzoli & Bianchi 1987; Garzoli & Garrafo 1989 ). Mean Brazil Current transport above 800 m of ~10 Sv at 37.5 S. ●Here: Continuous observations of the Brazil Current transport at 34.5°S since 2009. Introduction & Motivation
. Mean Brazil Current transport above 800 m of ~10 Sv at 37.5 S. ●Here: Continuous observations of the Brazil Current transport at 34.5°S since Introduction & Motivation.")
3
PIES/CPIES (NOAA, USP, UCP, UBR ) ADCP/BPR (USP) Short Moorings (UCP ) Tall Moorings (UBO) Bottom ADCP (UCP ) Thermistor mooring (UCP) Figure: Courtesy Chris Meinen SAMBA ARRAY Main Objective: Observe and understand the mechanisms that control the mean and time-varying MOC in the South Atlantic and the interocean exchanges.
 ADCP/BPR (USP) Short Moorings (UCP ) Tall Moorings (UBO) Bottom ADCP (UCP ) Thermistor mooring (UCP) Figure: Courtesy Chris Meinen SAMBA ARRAY Main Objective: Observe and understand the mechanisms that control the mean and time-varying MOC in the South Atlantic and the interocean exchanges.")
4
SAM, Southwest Atlantic MOC project Study western boundary components of the MOC in the South Atlantic. Collaboration between US, Brazil and Argentina. 4 PIES (2009 – present) PIs: C. Meinen, S. Garzoli, R. Perez and S. Dong. Funded by NOAA, US. 3 CPIES (2012 – present) PI: E. Campos. Funded by FAPESP, Brazil. Depth [km]
 PIs: C. Meinen, S. Garzoli, R. Perez and S. Dong. Funded by NOAA, US. 3 CPIES (2012 – present) PI: E. Campos. Funded by FAPESP, Brazil. Depth [km].")
5
CPIES: Current and Pressure Equipped Inverted Echo Sounder tau -- round trip travel times of acoustic pulses to sea surface and back. bottom pressure. bottom temperature. currents 50 m above the seafloor. tau combined with hydrography: estimates of full water column T, S, density and geopotential anomaly profiles using GEM look up tables (Meinen et al. 2012 and 2013). Baroclinic component: geostrophic velocities rel. to the bottom. Barotropic component: Time varying geostrophic velocities from bottom pressure measurements. Add time-mean bottom velocity from model.
. Baroclinic component: geostrophic velocities rel. to the bottom. Barotropic component: Time varying geostrophic velocities from bottom pressure measurements. Add time-mean bottom velocity from model..")
6
Time-mean absolute velocity section from PIES Adapted from Meinen et al. 2012 Southward flow of the Brazil Current at the western side of the array between sites A (51.5°W) and B (49.5°W). Array misses a portion of the Brazil Current inshore of site A. Strongest velocity variability in the upper 800-1000 m. Time-mean bottom velocities from high-resolution model (Combes and Matano, 2014)
 and B (49.5°W). Array misses a portion of the Brazil Current inshore of site A. Strongest velocity variability in the upper m. Time-mean bottom velocities from high-resolution model (Combes and Matano, 2014).")
7
Salinity section at 34.5°S – SACW/AAIW interface? Water masses (Preu et al. 2012): SACW: S > 35 psu AAIW: S < 34.25 psu UCDW: 27.75 < γ n < 27.90 O 2 < 4.5 mL L -1 NADW: 27.90 < γ n < 28.10 S > 34.8 psu. LCDW: 28.06 < γ n < 28.20 S < 34.8 psu AABW: θ < 0°C. Brazil Current: from the surface to SACW/AAIW interface at γ n = 26.82 kg m -3 (same as Biló et al. 2014)
: SACW: S > 35 psu AAIW: S < psu UCDW: < γ n < O 2 < 4.5 mL L -1 NADW: < γ n < S > 34.8 psu. LCDW: < γ n < S < 34.8 psu AABW: θ < 0°C. Brazil Current: from the surface to SACW/AAIW interface at γ n = kg m -3 (same as Biló et al. 2014).")
8
Brazil Current transport between 51.5°W (A) and 49.5°W (B) Absolute transport is mostly southward; occasionally northward. Large fluctuations of 30 Sv in short periods of 3 to 5 weeks. Absolute (including AA): -9.5 ± 7.5 Sv Baroclinic (including AA): -3.7 ± 5.8 Sv Barotropic (including AA): -5.6 ± 4.2 Sv AA
: -9.5 ± 7.5 Sv Baroclinic (including AA): -3.7 ± 5.8 Sv Barotropic (including AA): -5.6 ± 4.2 Sv AA.")
9
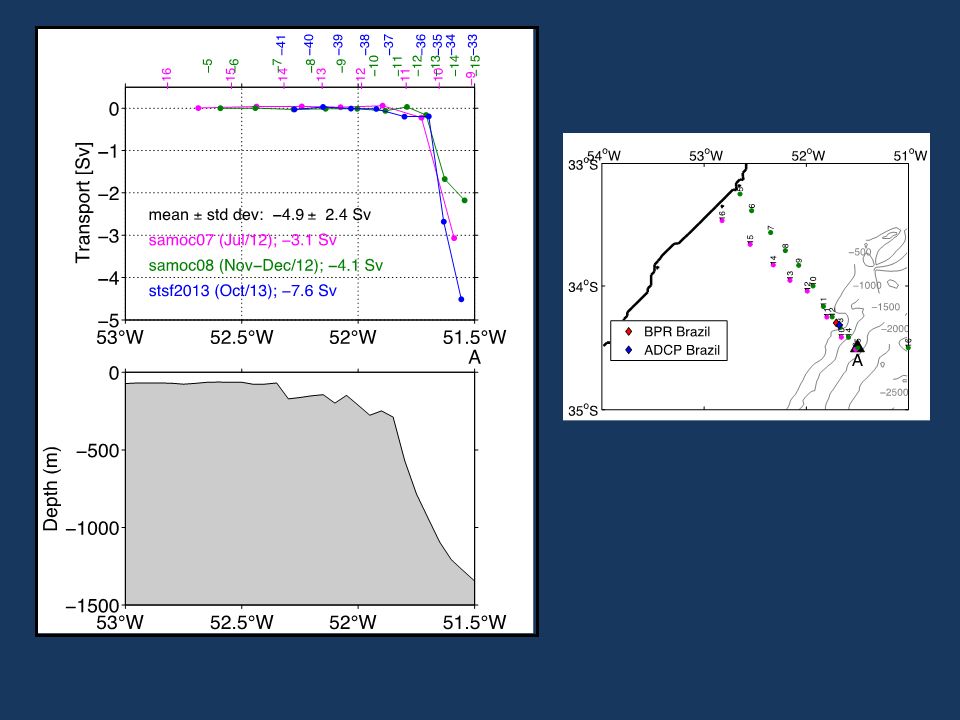
Transport inshore 51.5°W (A)? – CTD sections Transport inshore A: -4.9 ± 2.4 Sv (baroclinic from 3 hydrographic sections).
..")
10
Transport inshore 51.5°W (A)? – Models Absolute transport inshore A represents ~30% of the mean transport. Transport A to B overestimates variability by ~ 15-20% (compared with transport from the coast to B) Model time-mean absolute meridional velocity along 34.5°S between the coast and site B. BB ROMS_AGRIF (Combes and Matano, 2014) 2000-2012 OFES 1980-2010 Inshore A -3.8 ± 4.6 Sv Inshore A -3.0 ± 1.6 Sv
 Model time-mean absolute meridional velocity along 34.5°S between the coast and site B. BB ROMS_AGRIF (Combes and Matano, 2014) OFES Inshore A -3.8 ± 4.6 Sv Inshore A -3.0 ± 1.6 Sv.")
11
Spectral analysis – Brazil Current transport Absolute transport: 60% of the variance associated with periods shorter than 80 days. Peaks at 40, 20, and 10 days. Baroclinic transport: 75% of the variance associated with periods less than 120 days. Barotropic transport: 65% of the variance associated with periods shorter than 50 days. 40 d 20 d 10 d 20,10 d

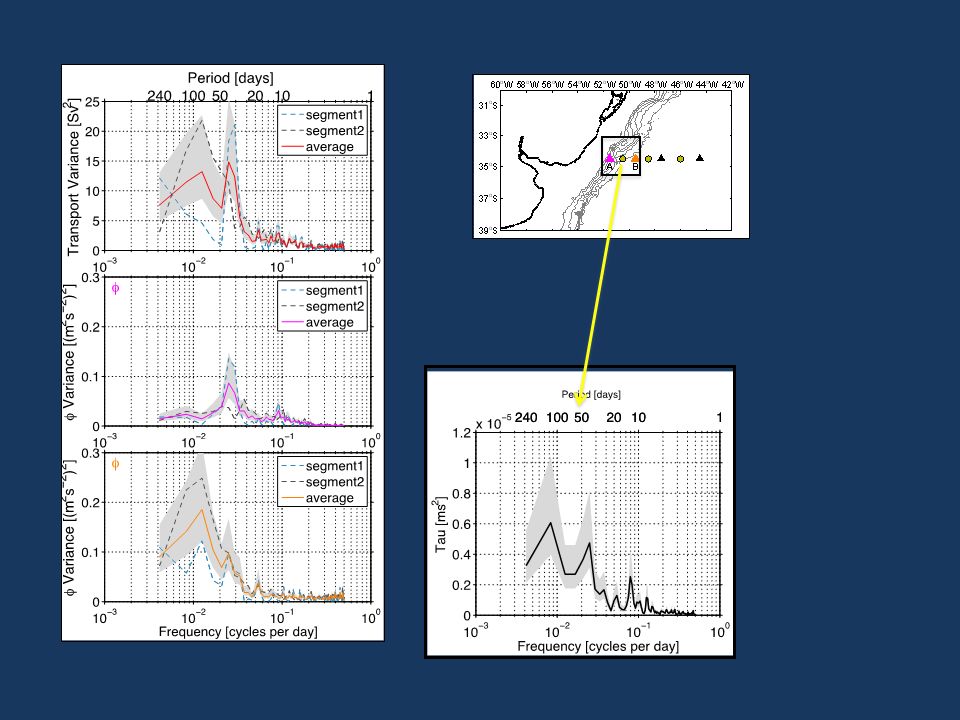
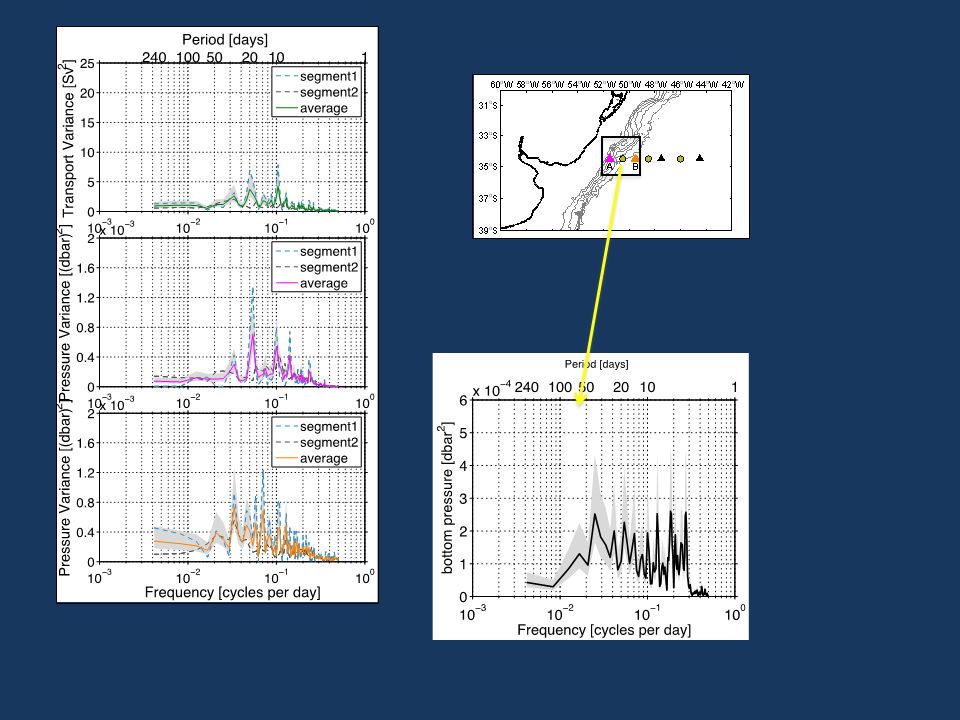
12
Spectral analysis – geopotential anomaly Φ and bottom pressure at 51.5°W (A) and 49.5°W (B) (endpoints) Φ at B: more variability at longer periods (50 to 80 days) compared to Φ at A. Bottom pressure at A and B: peaks at 30, 20, 10 days.

13
Seasonal and interannual variability - Brazil Current transport Brazil Current: strengthens on May and Dec; weakens on Feb and July No significant seasonal cycle is found during 2009-2014.

14
Seasonal and interannual variability - Brazil Current transport Mean annual absolute transport is remarkably steady. Brazil Current: strengthens on May and Dec; weakens on Feb and July No significant seasonal cycle is found during 2009-2014.

15
Observed basin-wide MOC and Brazil Current transport at 34.5°S

16
Strength of basin-wide MOC and Brazil Current not significantly correlated during first year of continuous measurements. r = 0.22

17
Conclusions ●Absolute Brazil Current transport at 34.5°S is -13.5 0.8 Sv with a temporal standard deviation of 6.3 Sv. ●Fluctuations with periods shorter than 80 days account for 60% of the absolute transport variance. ●Baroclinic transport mostly contributes variability at periods less than 100 days; barotropic transport contributes shorter-term fluctuations with periods less than 30 days. ●Baroclinic transport variability accounts for the largest fraction of the absolute transport variability (80%). ●No significant seasonal cycle is found during 2009-2014. ●Mean annual absolute transport is remarkably steady.
. ●No significant seasonal cycle is found during ●Mean annual absolute transport is remarkably steady..")
18
Conclusions ●Absolute Brazil Current transport at 34.5°S is -13.5 0.8 Sv with a temporal standard deviation of 6.3 Sv. ●Fluctuations with periods shorter than 80 days account for 60% of the absolute transport variance. ●Baroclinic transport mostly contributes variability at periods less than 100 days; barotropic transport contributes shorter-term fluctuations with periods less than 30 days. ●Baroclinic transport variability accounts for the largest fraction of the absolute transport variability (80%). ●No significant seasonal cycle is found during 2009-2014. ●Mean annual absolute transport is remarkably steady. THANK YOU!
. ●No significant seasonal cycle is found during ●Mean annual absolute transport is remarkably steady. THANK YOU!.")
19
ROMS AGRIF

25
ROMS_AGRIF (Combes and Matano, 2014) Parent grid: Spatial resolution 1/4˚ (~23 km near 34˚S). Child grid: 82˚W a 41˚W; 64˚S- 20˚S, spatial resolution 1/12˚. 40 sigma levels in the vertical; increased resolution near the surface. Transport inshore 51.5°W? – high-res. model

26
AuthorSourceMean/st d dev (Sv) Average Mean/std dev (Sv) Notes Meinen et al. (2013)18 XBT sections-2.1/2.5Baroclinic OFES-3.0/1.6Absolute NEMO-4.6/3.3Absolute This studyCTD SAMOC07 (Jul/12) -3.4Baroclinic CTD SAMOC08 (Nov-Dec/12) -4.1 -4.9/2.4Baroclinic CTD STSF2013 (Oct/13) -7.6Baroclinic ROMS_AGRIF (Combes and Matano, 2014) -3.8/4.6Absolute Transport inshore 51.5°W ? - Summary
18 XBT sections-2.1/2.5Baroclinic OFES-3.0/1.6Absolute NEMO-4.6/3.3Absolute This studyCTD SAMOC07 (Jul/12) -3.4Baroclinic CTD SAMOC08 (Nov-Dec/12) /2.4Baroclinic CTD STSF2013 (Oct/13) -7.6Baroclinic ROMS_AGRIF (Combes and Matano, 2014) -3.8/4.6Absolute Transport inshore 51.5°W . - Summary.")
27
A095

29
Gridded SHH Product Low orrelations (0.2-0.3) with PIES at A SSH from PIES and SSH from altimetry –Site A
 with PIES at A SSH from PIES and SSH from altimetry –Site A")
30
Transport inshore A? - SSH from PIES and SSH from altimetry

31
Water masses - neutral density layers (γ n, kg m -3 ) from PIES
 from PIES")
32
Transport calculation f: Coriolis parameter L: distance between sites Baroclinic component (relative geostrophic velocities) Φ: geopotential anomaly Barotropic component: -Time varying absolute geostrophic velocities from bottom pressure gauges. -Add time-mean bottom velocity from model.

33
Mean absolute meridional velocity ROMS_AGRIF

34
ROMS AGRIF

Similar presentations


>")


>")


 Surface Global zonal mean.>")


 51% of the heat input into the ocean is used for evaporation. Evaporation starts when the air over the ocean is unsaturated.>")
 Silvia Garzoli, Bob Molinari, Claudia Schmid (NOAA/AOML), Huiqin Yang (CIMAS/UM)>")

 estimated from: (red) CFC-12 inventories, (black) mixed layer depth and (green) volume transport residual. Also.>")

 Water V.Y. Chow EPS 131 12 Dec 2005.>")