Download presentation
Presentation is loading. Please wait.

1
Cement Outlook: 2011-2015 Ed Sullivan, Chief Economist PCA International Homebuilders Show January 2011

2
Overview - Forecast

3
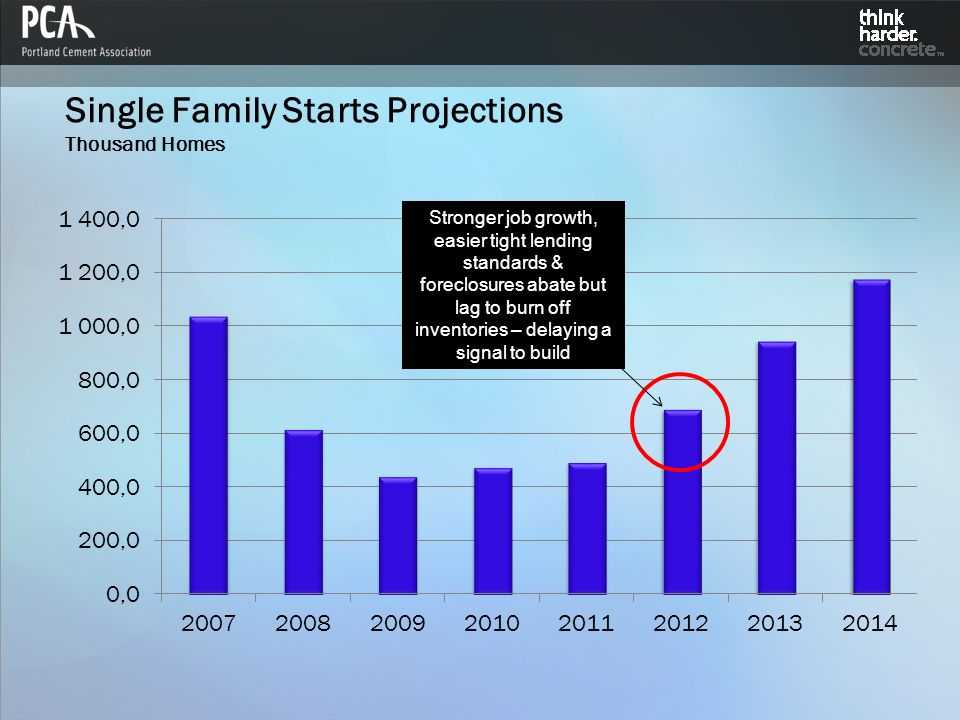
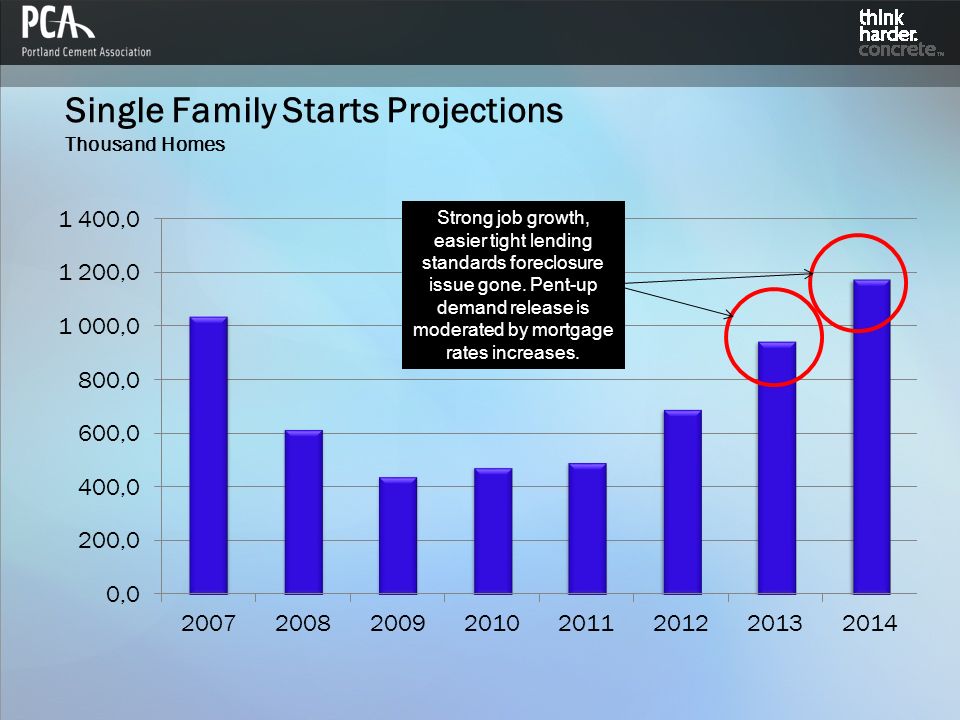
Single Family Starts Projections Thousand Homes

6
Criteria For Starts Recovery

7
Ingredients for a Starts Recovery Inventory no higher than 5 months supply Price stability Carry costs erode expected ROI. Weaker the price environment…lowers the months’ supply trigger point. Homebuilders Expected ROI

8
Economic Outlook

9
Sub-Prime/Exotics Lending Standards Energy Labor Markets 2006 2008 2007 2009 2010 State Deficits Economic Adversity Abates 2011/12 The abatement of the conditions that put us in recession…are receding…but remain in place. 2011

10
Synchronized Recovery Theory Incremental Demand Gains Job Gains Sentiment Gains Lending Standards Ease & Hiring Accelerates Heals Structural Restraints In the context of moderating productivity Gains Leads to: Sentiment includes Consumer, Business & Banks: Defaults & perceived lending risks decline

11
Home Sales Outlook

12
Cumulative Job Gains Net change, thousand jobs Source: Federal Reserve 2011 2010 2012 Projected

14
Single Family Sales Outlook Thousands of Units, SAAR Source: PCA Projections

15
Foreclosure Outlook

16
Foreclosures Accelerate Foreclosure Impacts Add to Inventory Depress Prices 2.8 Foreclosures in 2009. 871K Bank possessions. Equates to one out of every 4 homes on the market. Depressed Homebuilder ROI Adds supply. Bank owned properties discounted. Pressures new home prices. Longer carry costs. Lower revenues. Erodes expected ROI. Delays recovery in starts.

17
Residential: Re-Set Scenario $ Billion Subprime Resets Alt-A Option Adjustable

18
Residential: Bank Possession Projections Million Homes

19
Inventory Outlook

20
Months’ Supply: Single Family Number of months required to burn off existing inventory at current selling rates Source: PCA Projections Projected

21
Visible Vs Shadow Months’ Supply Single Family Source: PCA Projections Months’ Supply No Shadow 2.5 Mil Shadow 7.0 Mil Shadow

22
Regional Outlook

23
19% 56% 25% Pre-Boom Market Share

24
Putting Things Into Context

25
Residential: Upside Risks Thousand Starts Pessimists Optimists Single Family Starts Projections 201020112012201320142015 PCA4764926909451,1751,236 Mortgage Bankers' Association477523686---- NAHB475575860---- National Association of Realtors473545758---- Non-PCA Average475548768---- Tons Per Start19 ---- Upside Risk (Million Tons)----1.0581.482---- Note: PCA Forecast November 2, 2010, MBA Forecast December 17,2010, NAHB Forecast December 23, 2010 NAHB Forecast December 23, 2010, NAR Forecast December 2010
 Note: PCA Forecast November 2, 2010, MBA Forecast December 17,2010, NAHB Forecast December 23, 2010 NAHB Forecast December 23, 2010, NAR Forecast December 2010")
26
Beyond the Crisis “New Normal” or “New Headaches”

27
American consumer, the engine of US economic growth May distance from debt spending patterns (lowering GDP). Baby boomers may not re-capture wealth Higher inflation erodes spending. Debt Stimulus spending must be paid. resulting in either higher interest rates, higher taxes, and potentially higher inflation – or all three High debt in context of weak dollar, heightens issue Fiscal austerity? Impacts Slower growth – Is 50 basis point enough? After the Crisis: “New Normal”: Economics

28
Fiscal Policy Stimulus spending must be paid for…resulting in higher interest rates, higher taxes, and potentially higher inflation. Monetary policy easing (U.S. & global) & QE2 Could add to inflationary pressures. QE2 compounds the inflationary risks. Raises prospects of Federal Reserve tightening. Weakens dollar in context of large public debt. Heightens debt costs. Key economic consequences American consumer, the engine of US economic growth, may distance from debt spending patterns (lowering GDP). Dollar may show a structural weakening. …combining for the potential of slower longer term economic growth (50 basis points). After the Crisis: “New Normal”: Policy
 & QE2 Could add to inflationary pressures. QE2 compounds the inflationary risks. Raises prospects of Federal Reserve tightening. Weakens dollar in context of large public debt. Heightens debt costs. Key economic consequences American consumer, the engine of US economic growth, may distance from debt spending patterns (lowering GDP). Dollar may show a structural weakening. …combining for the potential of slower longer term economic growth (50 basis points). After the Crisis: New Normal : Policy.")
29
Not a typical recession recovery. Amplified by structural corrections. Amplified by possible policy errors. Long impacts Pent-Up Demand Being generated across all sectors. Longer period of distress, more pent-up demand Timing and magnitude of release impacted by economy. Regional impacts from resulting growth. Residential, nonresidential & public synchronized – 2013 & Beyond. Typically suggests strong cement consumption growth rates. After the Crisis: “New Normal”: Construction

30
000 Starts Single Family Housing– United States Pent-Up Demand Interest Rates low, Decline in Home Price, Job Recovery Translate into Improved Affordability

31
Emerging economies, led by China/India, account for key growth drivers. Accounts for larger share of world GDP than OECD by 2014 (IMF). Exerts “new” potent demand on world markets “Synchronized” world growth returns 2013-2020. Commodity prices (oil), freight rates, trading patterns subject to change. Impacts concrete competitiveness (oil prices = paving position, residential ICF) Impacts sourcing decisions – high freight rates raising import costs. New challenges could lead to potentially new economic/political tensions. After the Crisis: “New Normal”: Global
. Exerts new potent demand on world markets Synchronized world growth returns Commodity prices (oil), freight rates, trading patterns subject to change. Impacts concrete competitiveness (oil prices = paving position, residential ICF) Impacts sourcing decisions – high freight rates raising import costs. New challenges could lead to potentially new economic/political tensions. After the Crisis: New Normal : Global.")
33
Researchers at the MIT Concrete Sustainability Hub are working to quantify the full cradle-to-grave life-cycle environmental and economic costs of paving and building materials. Residential Buildings – More than 90% of the life-cycle carbon emissions are due to the use phase, with construction and end-of-life disposal accounting for less than 10% of the total emissions. Residential Buildings – Concrete structures built with insulated concrete forms (ICF) enjoy long-term operational energy savings of 20% or more over wood- framed buildings. In the context of synchronized world growth, higher oil prices, homebuyers may increasingly emphasize energy saving aspects of concrete homes. After the Crisis: “New Normal”: MIT
 enjoy long-term operational energy savings of 20% or more over wood- framed buildings. In the context of synchronized world growth, higher oil prices, homebuyers may increasingly emphasize energy saving aspects of concrete homes. After the Crisis: New Normal : MIT.")
34
Per Home, Lifetime C02 Savings ICF Home Over Frame Co2 Metric Tons, Per Home Additional C02 Emitted by Cement Production Total Heating & Cooling C02 Saving: 92 Tons per Home Conservatively Assumes 50 Year Life of Home

35
Cement Outlook: 2011-2015 Ed Sullivan, Chief Economist PCA International Homebuilders Show January 2011

36
Multifamily Starts Projections Thousand Homes

Similar presentations