Download presentation
Presentation is loading. Please wait.

1
Ch. 14 Part 7 Blood Glucose Regulation

2
Glucose Carbohydrates transported in blood as soluble molecule called GLUCOSE – Monosaccharide – Ring structure in aqueous solution Carbohydrates stored as polysaccharide GLYCOGEN – Insoluble – Macromolecule of 1-4 linked alpha glucose molecules with 1-6 branches – Easily broken down into glucose Main respiratory substrate for many cells Healthy adult = 80-120 mg of glucose in 100 mL of blood Overview Video

4
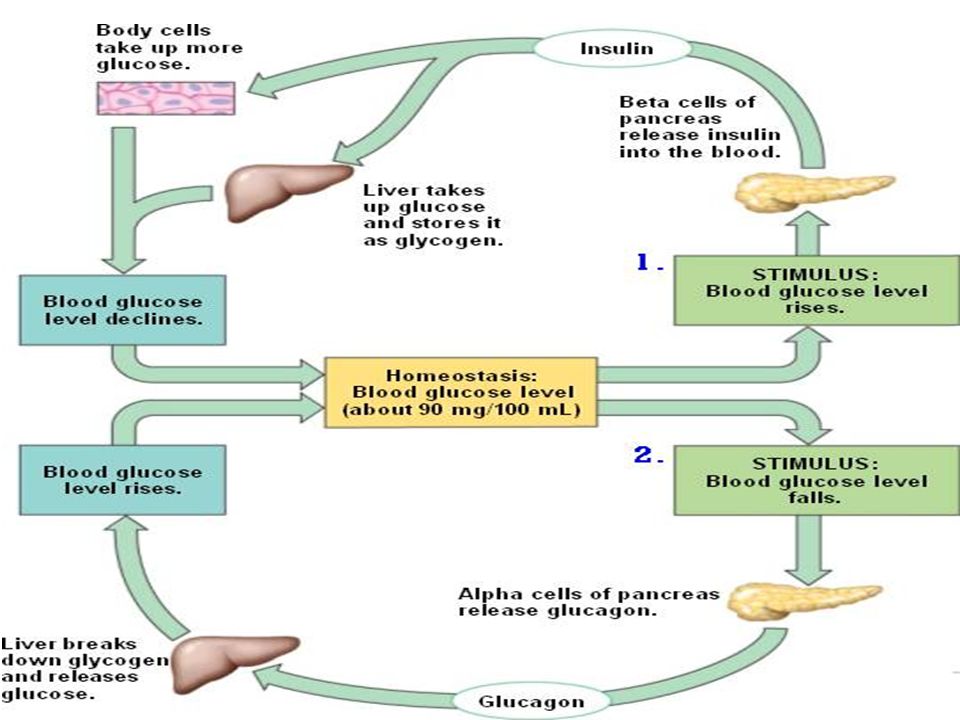
Pancreas Overview Tissue: Islets of Langerhans – Groups of cells in pancreas – Made of 2 types of RECEPTOR cells that are CENTRAL CONTROL for homeostasis of glucose Alpha Cells – Secrete hormone GLUCAGON Beta Cells – Secrete hormone INSULIN – Hormones of pancreas coordinate actions of EFFECTORS Liver Cells Muscle Cells Fat (adipose) cells
 cells")
5
Glucagon Glucagon is a 29-amino acid polypeptideamino acid Regulates the levels of glucose in the bloodstream Produced by the alpha cells of the islets of Langerhans (pancreas) Opposite effect from insulin – acts to increase blood sugar levels by stimulating the breakdown of liver glycogen to glucose (glycogenolysis), increasing release of glucose from the liver into the blood, preventing the liver from storing glucose, and increasing glucose formation in the liver from dietary protein(amino acids) and fats liverglycogenglucosebloodproteinamino acidsfats
 Opposite effect from insulin – acts to increase blood sugar levels by stimulating the breakdown of liver glycogen to glucose (glycogenolysis), increasing release of glucose from the liver into the blood, preventing the liver from storing glucose, and increasing glucose formation in the liver from dietary protein(amino acids) and fats liverglycogenglucosebloodproteinamino acidsfats")
6
Insulin Signaling molecule Two long polypeptide chains – Chain A with 21 amino acids – Chain B with 30 amino acids – Two disulfide bridges covalently connect the chains Helps control blood glucose levels – signals the liver, muscle and fat cells to take in glucose from the blood Cannot pass through cell membrane Binds to transmembrane protein receptor – Initiates intracellular messengers when it binds Many cells have insulin receptors – Liver, muscle, and fat cells – Insulin stimulates these cells to increase the rate at which they absorb glucose, convert it to glycogen, and use it in respiration Causes decrease in concentration of glucose in blood

7
After large carb meal…. Glucose reabsorbed in small intestine into blood Blood flows through pancreas Alpha and Beta cells detect increase in glucose concentration Alpha cells response: – Stop the secretion of glucagon Beta cells response: – Secrete insulin into blood plasma Blood carries insulin to all parts of the body

8
What does Insulin do? Attaches to insulin receptors on cell membranes and: 1.Activate GLUT transporter protein containing vesicles to fuse with cell membrane 2.Stimulates the activation of enzymes: GLUKOKINASE PHOSPHOFRUCTOKINASE GLYCOGEN SYNTHASE Remember! Kinases are enzymes that add phosphate to things (phosphorylation!)
.")
9
How Glucose Enters Cells Glucose must enter cells through transporter proteins called GLUTs – GLUT 1: brain cells Regulated by blood glucose levels – GLUT 2: liver cells Always in cell membrane – GLUT 4: muscle cells Regulated by blood glucose levels GLUT proteins in vesicles kept in cytoplasm (like aquaporins) – Move to and fuse with cell membrane when insulin attaches to transmembrane receptor – Some GLUT transporters are always in membrane VIDEO
 – Move to and fuse with cell membrane when insulin attaches to transmembrane receptor – Some GLUT transporters are always in membrane VIDEO")
10
Enzyme Activation GLUCOKINASE – Phosphorylates glucose Keeps glucose in the cell (phosphorylated glucose cannot pass through transporter proteins) PHOSPHOFRUCTOKINASE – converts fructose 6-phosphate and ATP to fructose 1,6- bisphosphate and ADP in glycolysis – Helps add glucose to glycogen with the help of glycogen synthase GLYCOGEN SYNTHASE – Converts glucose to glycogen
 PHOSPHOFRUCTOKINASE – converts fructose 6-phosphate and ATP to fructose 1,6- bisphosphate and ADP in glycolysis – Helps add glucose to glycogen with the help of glycogen synthase GLYCOGEN SYNTHASE – Converts glucose to glycogen")
12
Decrease in Blood Glucose Concentration… Alpha and beta cells detect decease – Alpha cells secrete glucagon – Beta cells stop secreting insulin Reduce rate of glucose UPTAKE and glucose USE by liver and muscle cells – Uptake continues but at slower rate Glucagon binds to receptors in cell surface membrane of liver cells – Activates signal transduction pathway Glucose also made and added to blood by GLUCONEOGENESIS Due to release of glucagon Liver releases extra glucose to INCREASE blood glucose concentration – Muscle cells do NOT have receptors for glucagon so they do NOT resond to glucagon

13
Glucagon Signal Transduction Pathway Glucagon binds to receptor in membrane Conformational changes to transmembrane protein occur leading to ACTIVATION of G protein inside side (GDP GTP) G protein activates cell-membrane enzyme that catalyzes conversion of ATP to cyclic AMP (cAMP) “second messenger” cAMP binds to kinase enzymes in cytoplasm that activate other enzymes Final enzyme to be activated: GLYCOGEN PHOSPHORYLASE – Catalyzes the breakdown of GLYCOGEN to GLUCOSE = increase in concentration of glucose inside cell = glucose diffuses OUT of cell and into blood through GLUT2 transporter “Enzyme Cascade Amplification”
 G protein activates cell-membrane enzyme that catalyzes conversion of ATP to cyclic AMP (cAMP) second messenger cAMP binds to kinase enzymes in cytoplasm that activate other enzymes Final enzyme to be activated: GLYCOGEN PHOSPHORYLASE – Catalyzes the breakdown of GLYCOGEN to GLUCOSE = increase in concentration of glucose inside cell = glucose diffuses OUT of cell and into blood through GLUT2 transporter Enzyme Cascade Amplification")
14
GLUCONEOGENESIS “formation of glucose” Amino acids and lipids used to make glucose

15
Hormone Increases concentration of blood glucose Binds to different receptors in surface of liver cells – Activate same enzyme cascade – Same result: glycogen phosphorylase breaks down glycogen into glucose Stimulates breakdown of glycogen in muscle cells during exercise – Glucose released directly into muscle cell where it is needed

16
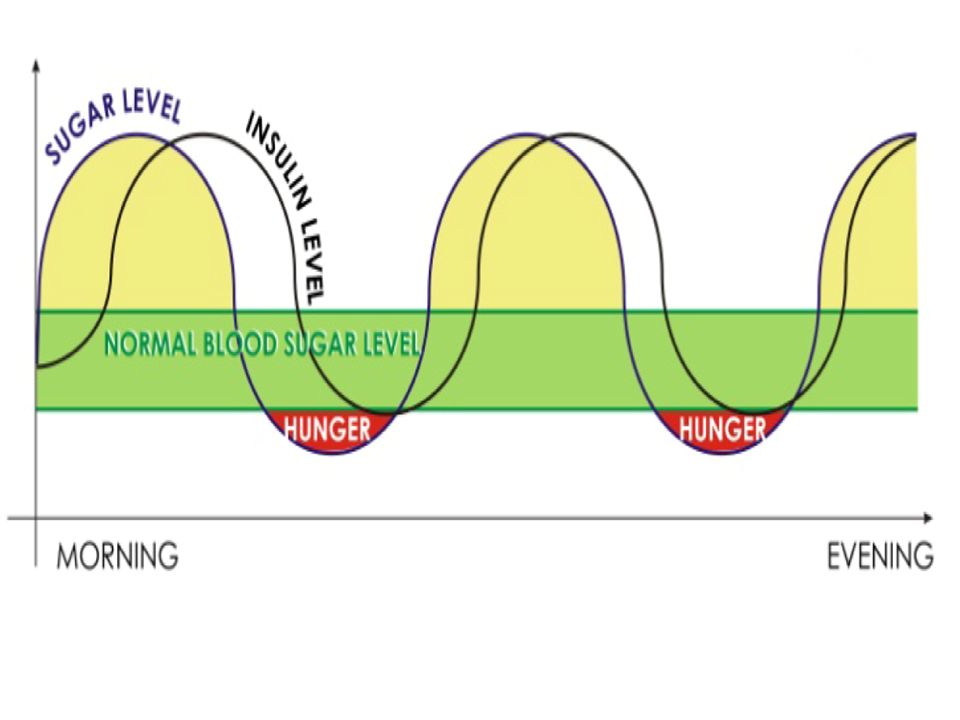
Glucagon and insulin work together Negative feedback system Receptors activated by any deviation of blood glucose concentration from set point Effectors will bring blood glucose concentration back to set point Blood glucose concentrations never constant – Time delay in change of blood glucose concentration and onset of actions to correct it – Time delays = oscillations in set point

19
Diabetes Mellitus “Sugar” diabetes 2013- 382 million people (8.3%) Two Types – Insulin-dependent diabetes (Type 1) – Non-insulin dependent diabetes (Type 2) Symptoms – Blood glucose concentration increases (after a meal) Normal conditions: no glucose in urine High blood glucose concentration: kidney not able to reabsorb all glucose = glucose in urine – Excess water and salts also not reabsorbed dehydration and hunger – Slow uptake of glucose from blood into cells – Cells lack glucose-> metabolize fats and proteins build up of keto-acids in blood = decrease in blood pH – Extreme conditions: Dehydration Salt loss Low blood pH – Between meals: blood glucose concentration drops drastically No glycogen to breakdown May result in coma
 Two Types – Insulin-dependent diabetes (Type 1) – Non-insulin dependent diabetes (Type 2) Symptoms – Blood glucose concentration increases (after a meal) Normal conditions: no glucose in urine High blood glucose concentration: kidney not able to reabsorb all glucose = glucose in urine – Excess water and salts also not reabsorbed dehydration and hunger – Slow uptake of glucose from blood into cells – Cells lack glucose-> metabolize fats and proteins build up of keto-acids in blood = decrease in blood pH – Extreme conditions: Dehydration Salt loss Low blood pH – Between meals: blood glucose concentration drops drastically No glycogen to breakdown May result in coma")
21
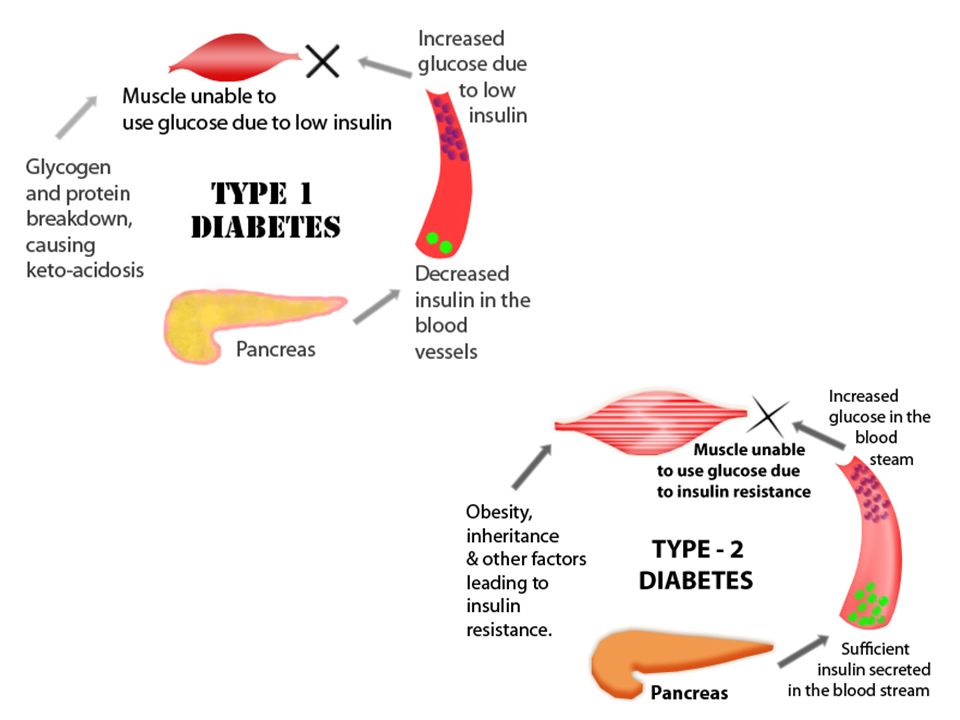
Insulin-dependent diabetes (Type 1) Pancreas incapable of secreting sufficient insulin – Deficiency in gene that codes for insulin production – Attack on beta cells by immune system “Juvenile” onset diabetes Regular insulin injections – Insulin made by genetically engineered cells Take blood samples to monitor effectiveness of insulin Controlled diet to maintain near constant levels of glucose Non-insulin dependent diabetes (Type 2) Pancreas DOES produce insulin – Liver and muscle cells do NOT respond properly to insulin Late onset (adult) Associated with obesity and diet Rarely need insulin injections Healthy diet Frequent excecise
 Pancreas incapable of secreting sufficient insulin – Deficiency in gene that codes for insulin production – Attack on beta cells by immune system Juvenile onset diabetes Regular insulin injections – Insulin made by genetically engineered cells Take blood samples to monitor effectiveness of insulin Controlled diet to maintain near constant levels of glucose Non-insulin dependent diabetes (Type 2) Pancreas DOES produce insulin – Liver and muscle cells do NOT respond properly to insulin Late onset (adult) Associated with obesity and diet Rarely need insulin injections Healthy diet Frequent excecise")
Similar presentations


>")

>")


. Respiration – a process in cells where glucose is broken down for.>")


