Download presentation
Presentation is loading. Please wait.

1
AP STATISTICS Mrs. Austin-Strand

2
Agenda ◦ Scavenger Hunt ◦ Syllabus ◦ TV Ratings ◦ Heart Rate Activity

3
TV Ratings ◦ http://www.nielsen.com/us/en/top10s.html http://www.nielsen.com/us/en/top10s.html ◦ What additional info is needed? ◦ How is this info helpful?

4
Heart Rate Activity ◦ Materials: Clock or watch with second hand ◦ A person’s pulse rate provides information about the health of his or her heart. Would you expect to find a difference between male and female pulse rates? In this activity, you and your classmates will collect some data to try to answer questions.

5
Heart Rate Activity 1.To determine your pulse rate, hold the fingers of one hand on the artery in your neck or on the inside of your wrist. (DO NOT USE THUMB!!!) 2.Count the number of pulse beats in one minute. Do this 3 times and calculate your AVERAGE individual pulse rate. Why is doing this three times better than doing it once? 3.Record the pulse rates for the class in a table, with one column for males and a second column for females. Are there any unusual pulse rates? 4.For now, simply calculate the average pulse rate for the males and the average pulse rate for the females, and compare.
 2.Count the number of pulse beats in one minute. Do this 3 times and calculate your AVERAGE individual pulse rate. Why is doing this three times better than doing it once. 3.Record the pulse rates for the class in a table, with one column for males and a second column for females. Are there any unusual pulse rates. 4.For now, simply calculate the average pulse rate for the males and the average pulse rate for the females, and compare..")
11
REVIEW

12
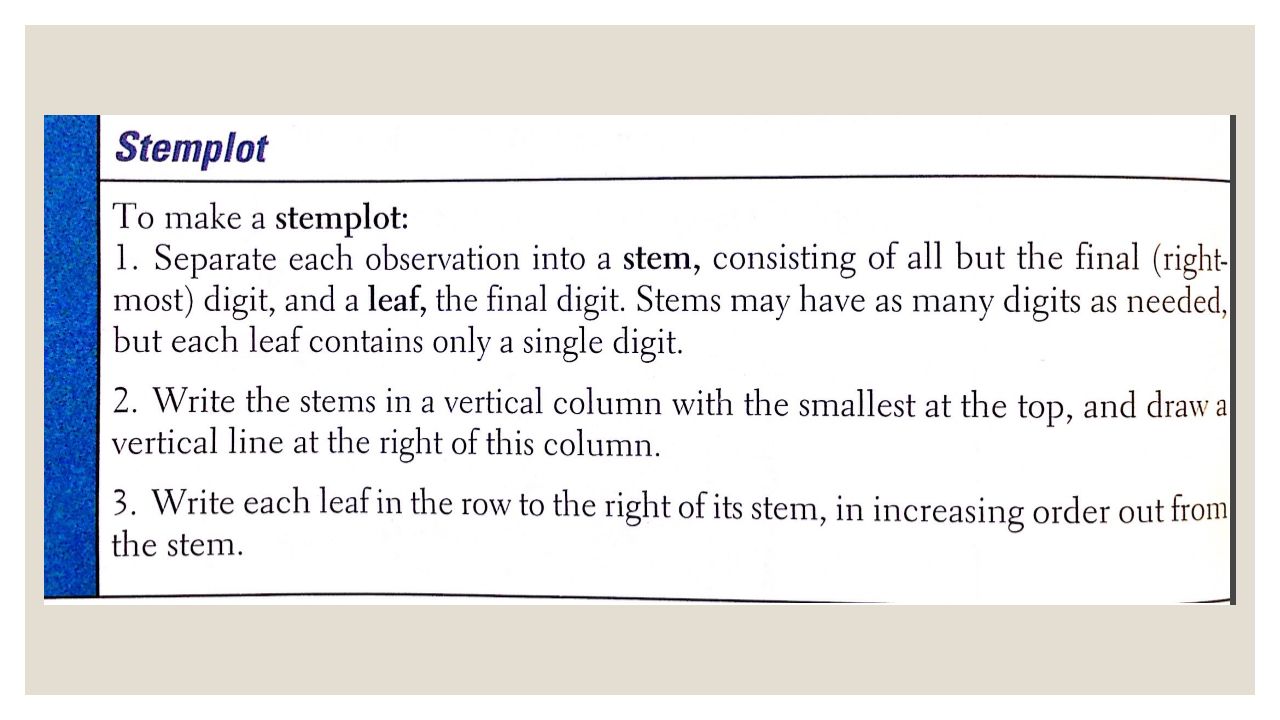
Stemplots ◦ Large data sets where each stem must hold a large number of leaves ◦ Splitting Stems (Leaves 0-4/5-9) ◦ Trimming
 ◦ Trimming")
13
HISTOGRAMS

14
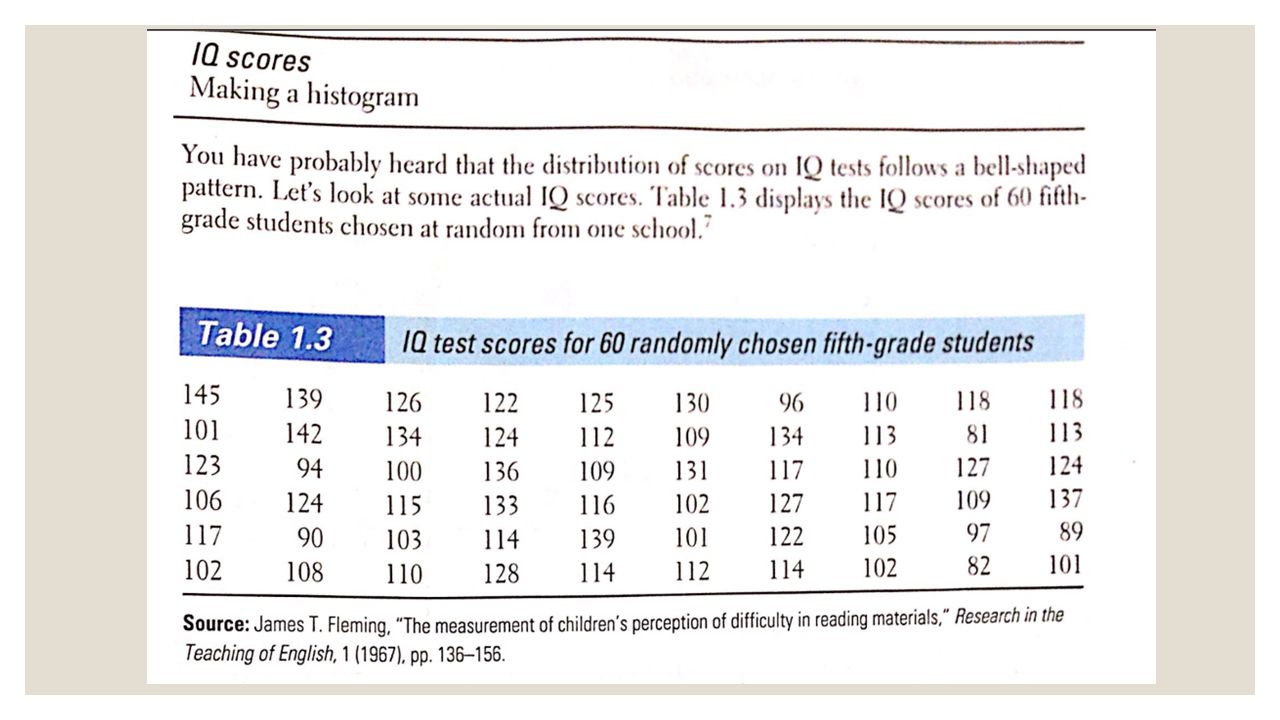
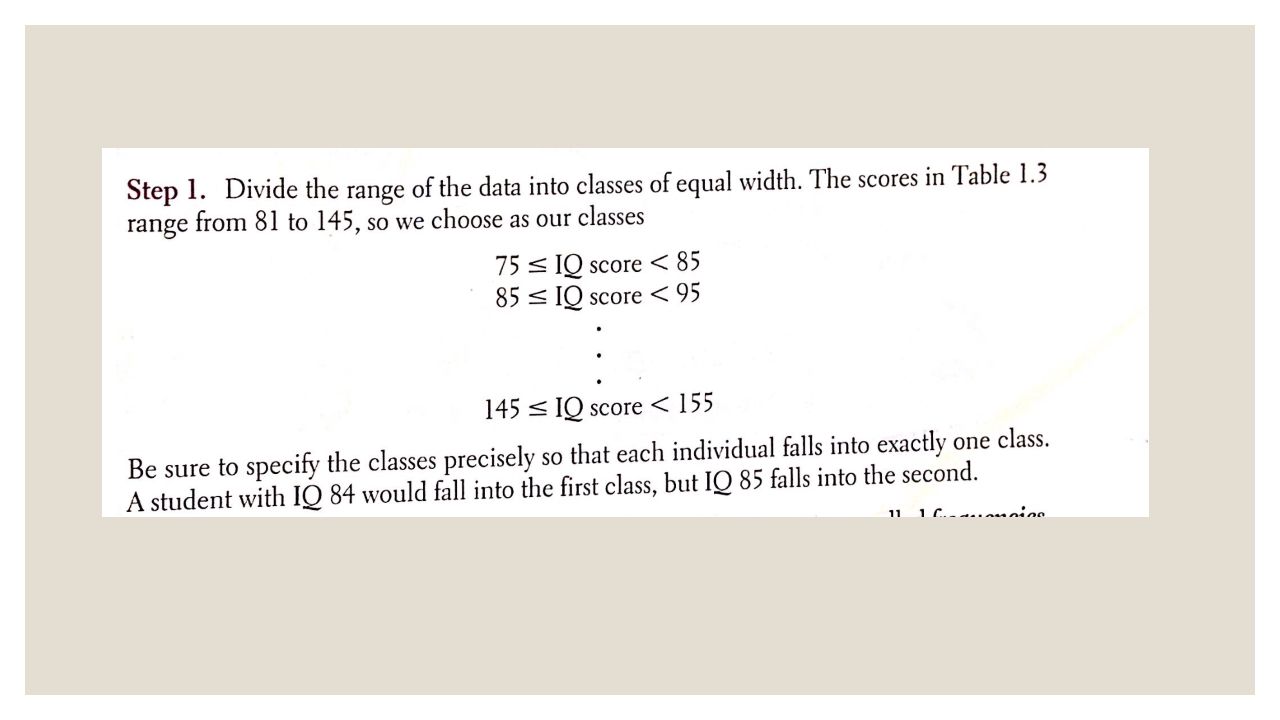
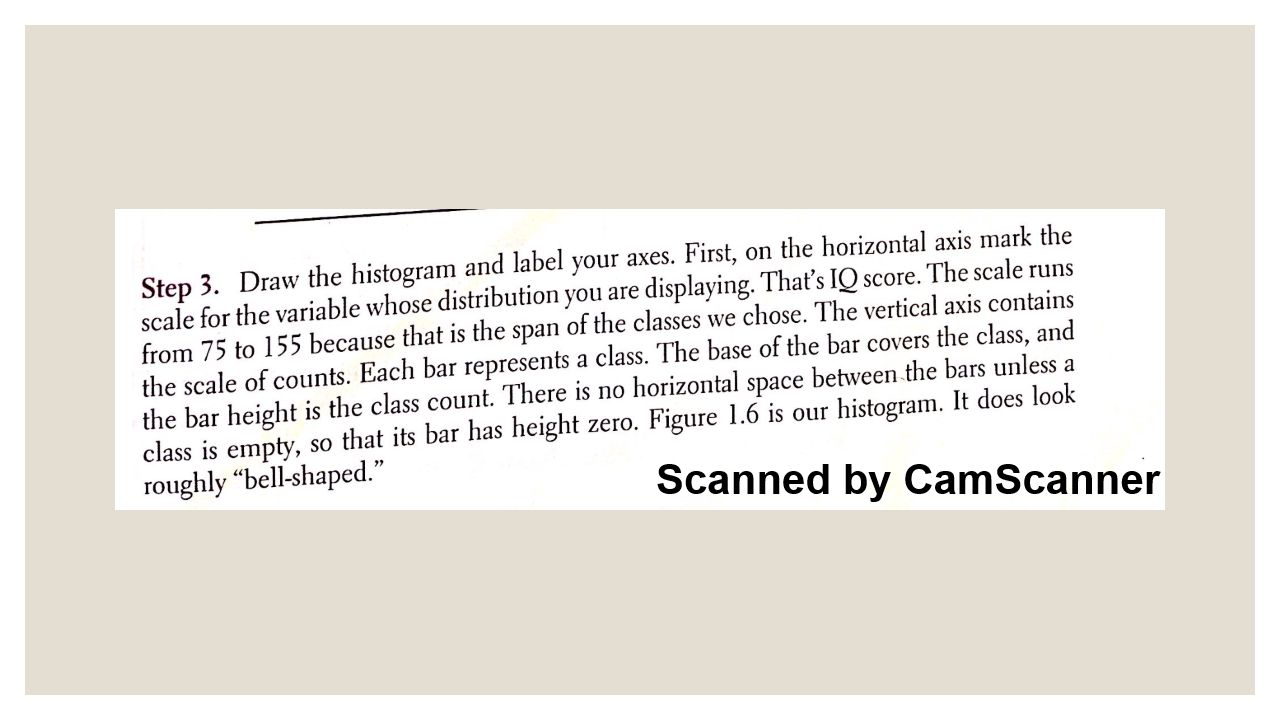
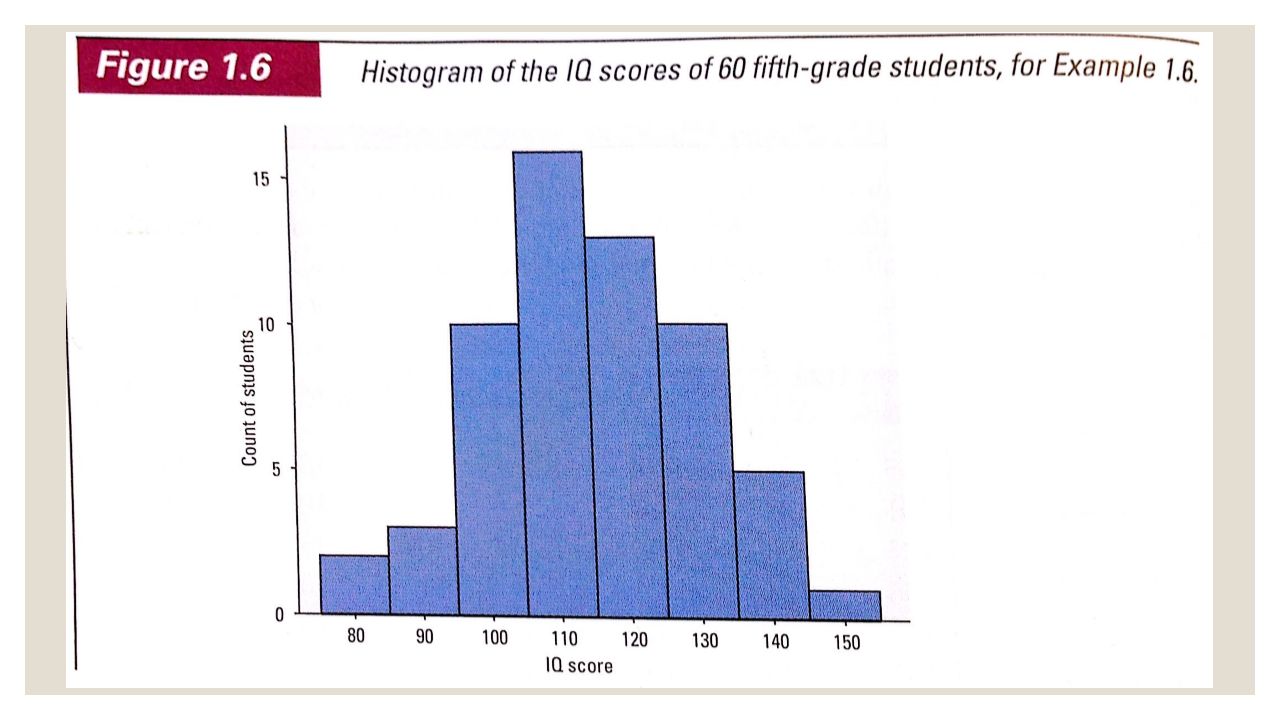
Histograms ◦ Stemplots vs Histograms ◦ HISTOGRAM: breaks the range of values of a variable into CLASSES and displays only on the count or percent of the observations that fall into each class ◦ Any # of classes ◦ EQUAL WIDTH

20
Histogram Tips ◦ Same width ◦ No one right choice of classes ◦ Skyscraper vs Pancake ◦ Software and calculators ◦ Use histograms of percents for comparing several distributions with different numbers of observations

21
EXAMINING DISTRIBUTIONS

23
Examining Distributions ◦ Midpoint : describes the center of distribution. It is the value with roughly half the distributions taking smaller values and half taking larger values ◦ Modes: Peaks ◦ Unimodal: One major peak ◦ Symmetric ◦ Skewed- tail

24
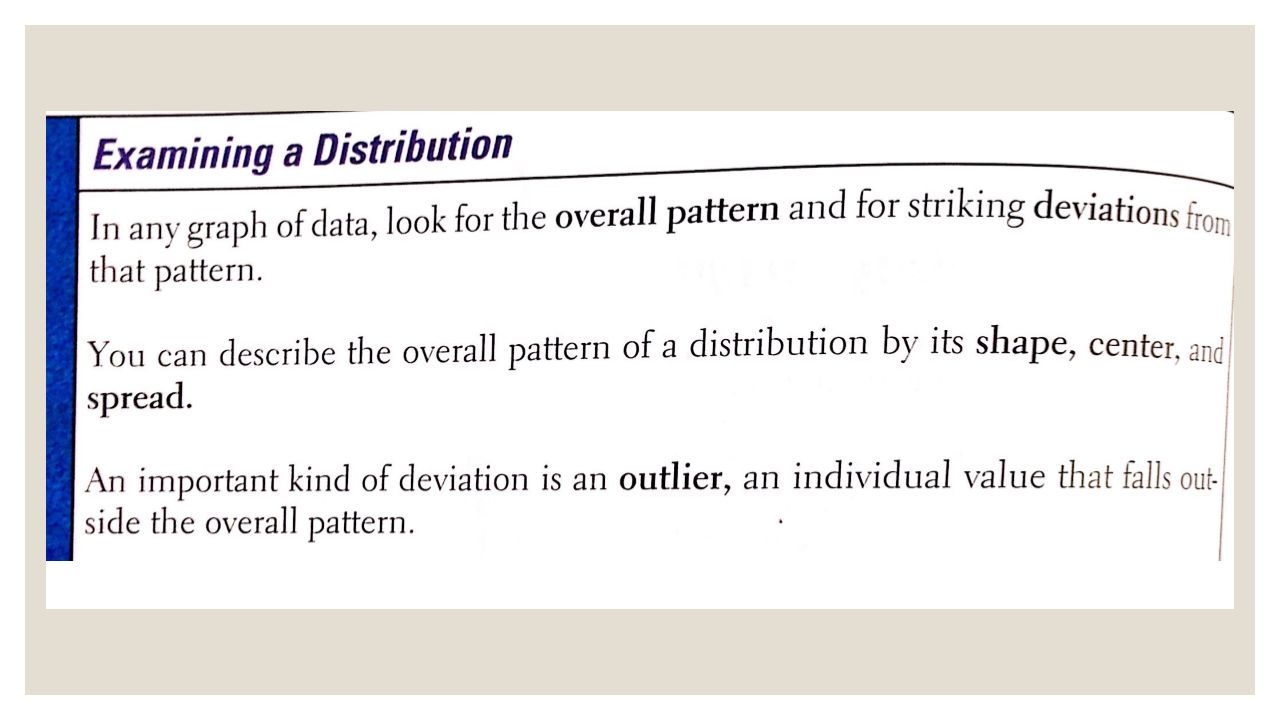
Describing Distribution ◦ Shape? ◦ Center? ◦ Spread?

25
Outliers ◦ Matter of judgment ◦ Look for points that are clearly apart ◦ Explanation ◦ Errors and Environment

26
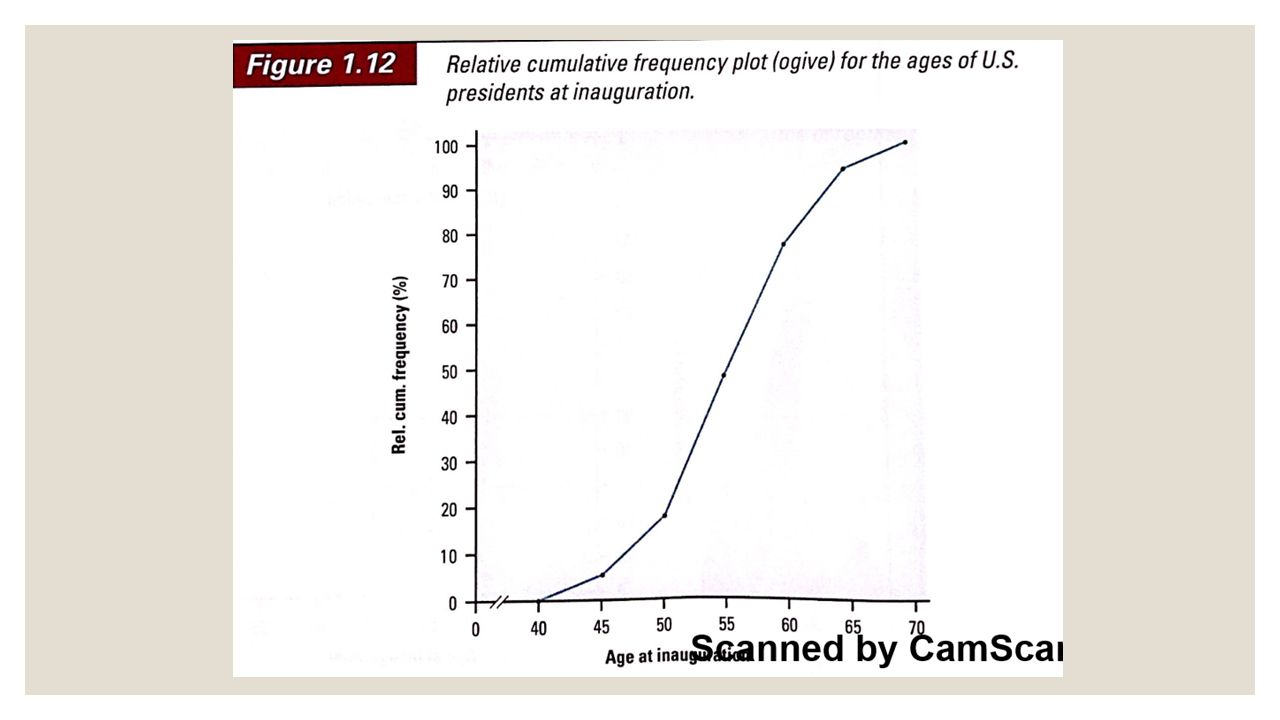
RELATIVE AND CUMULATIVE FREQUENCY

27
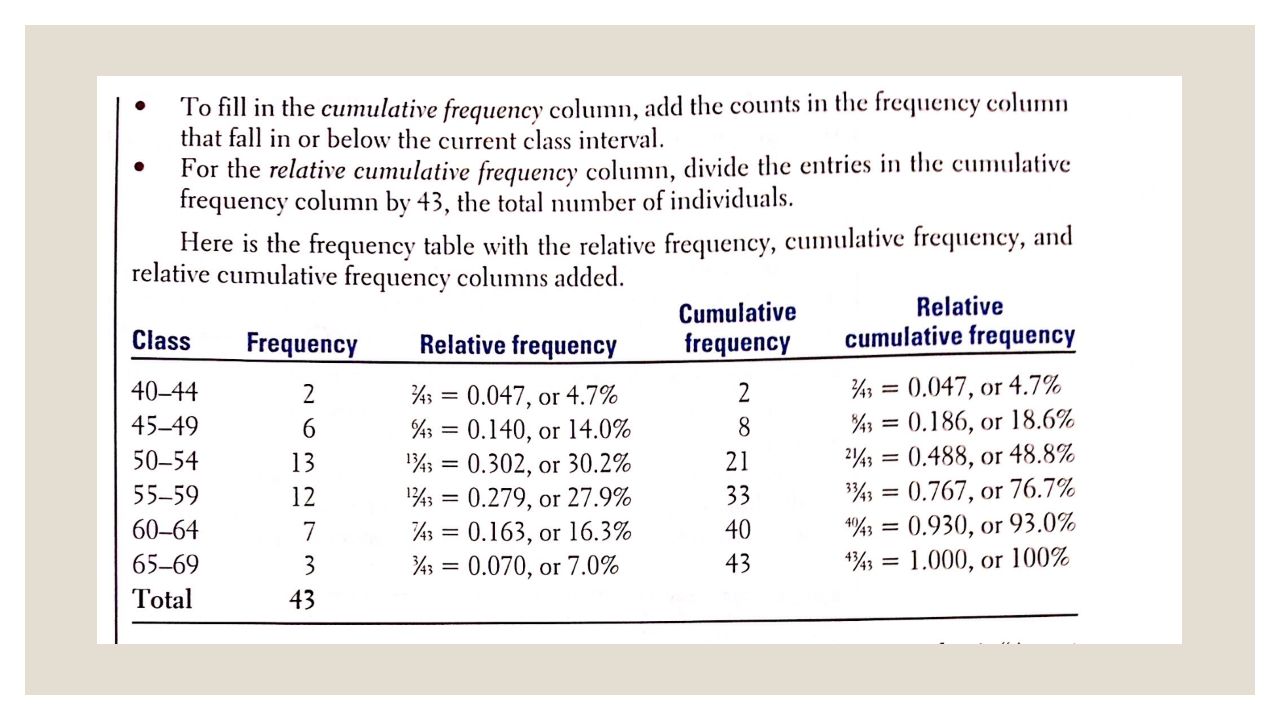
Relative and Cumulative Frequency Histograms-quantitive variables, tells us little about relative standing of an individual observation

32
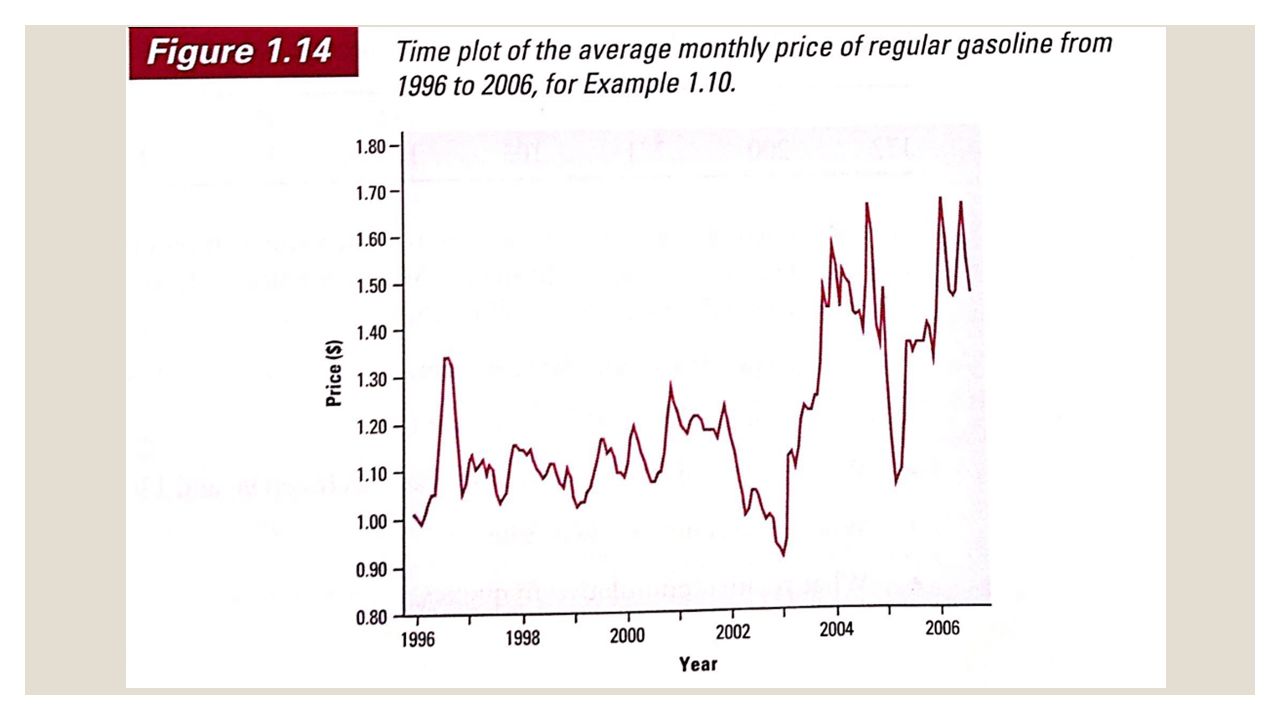
Time Plot ◦ Of a variable plots each observation against the time at which it was measured ◦ Horizontal-Time ◦ Vertical-Variable being measured

34
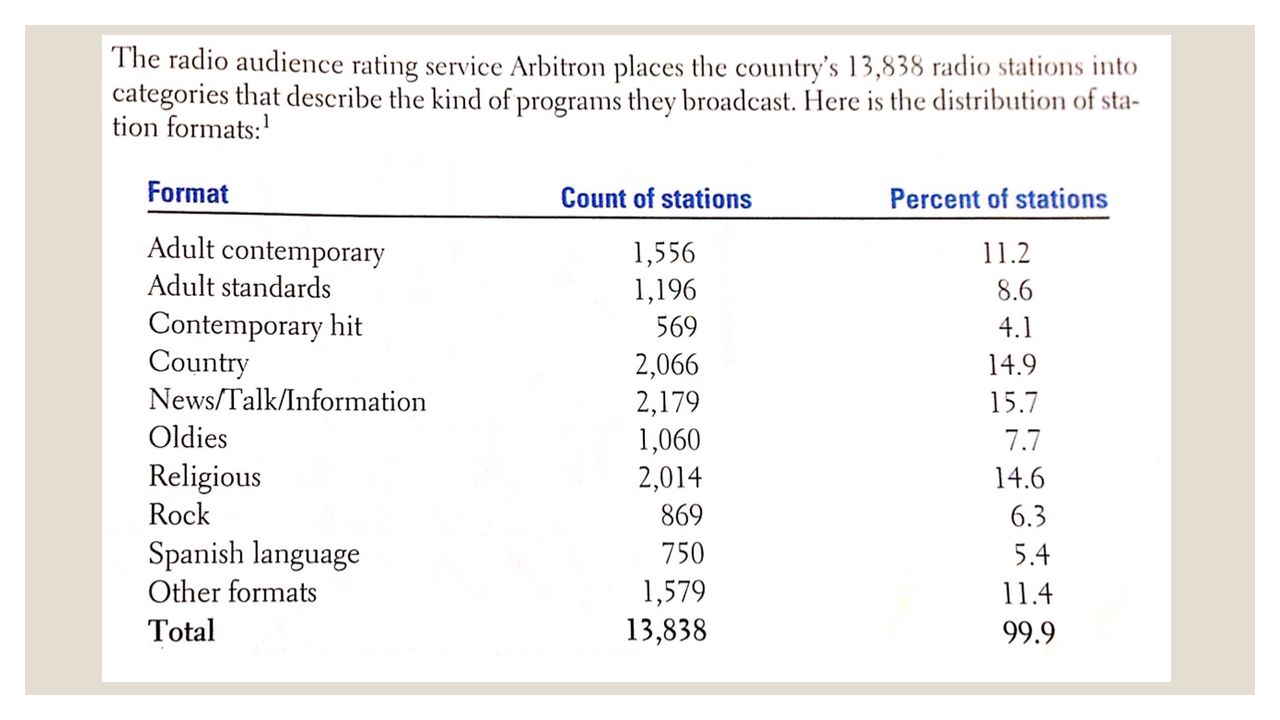
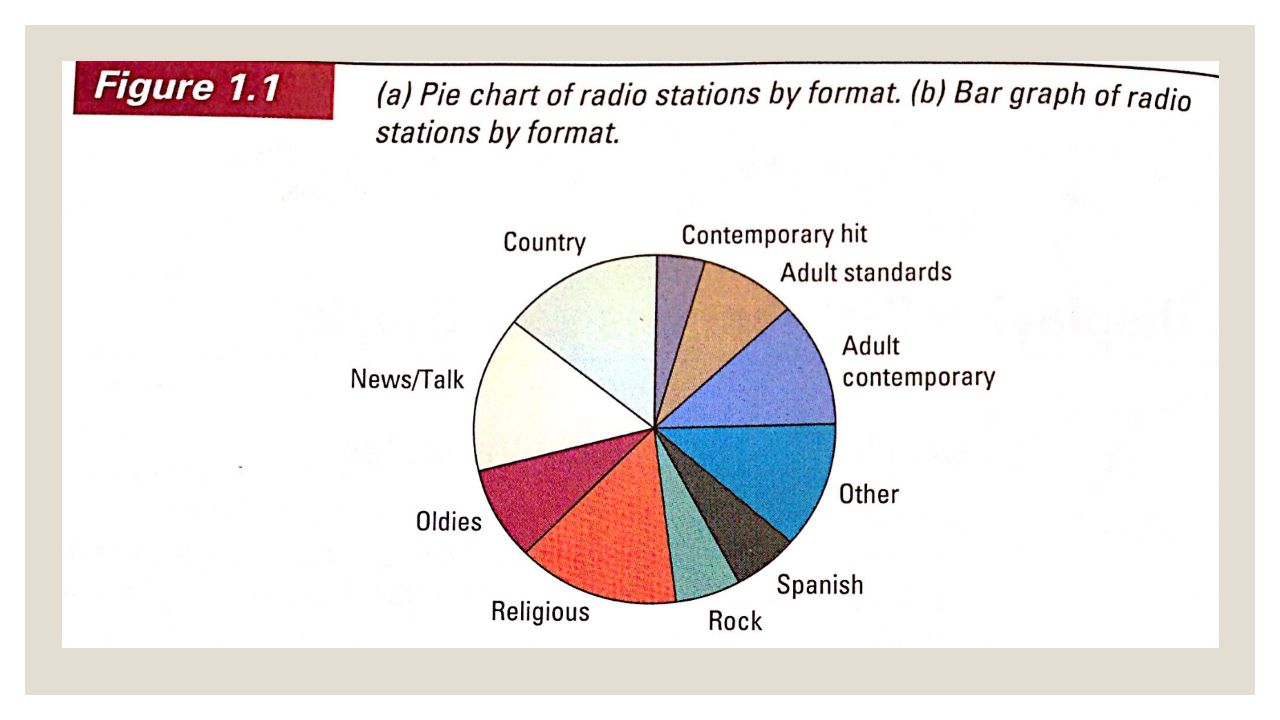
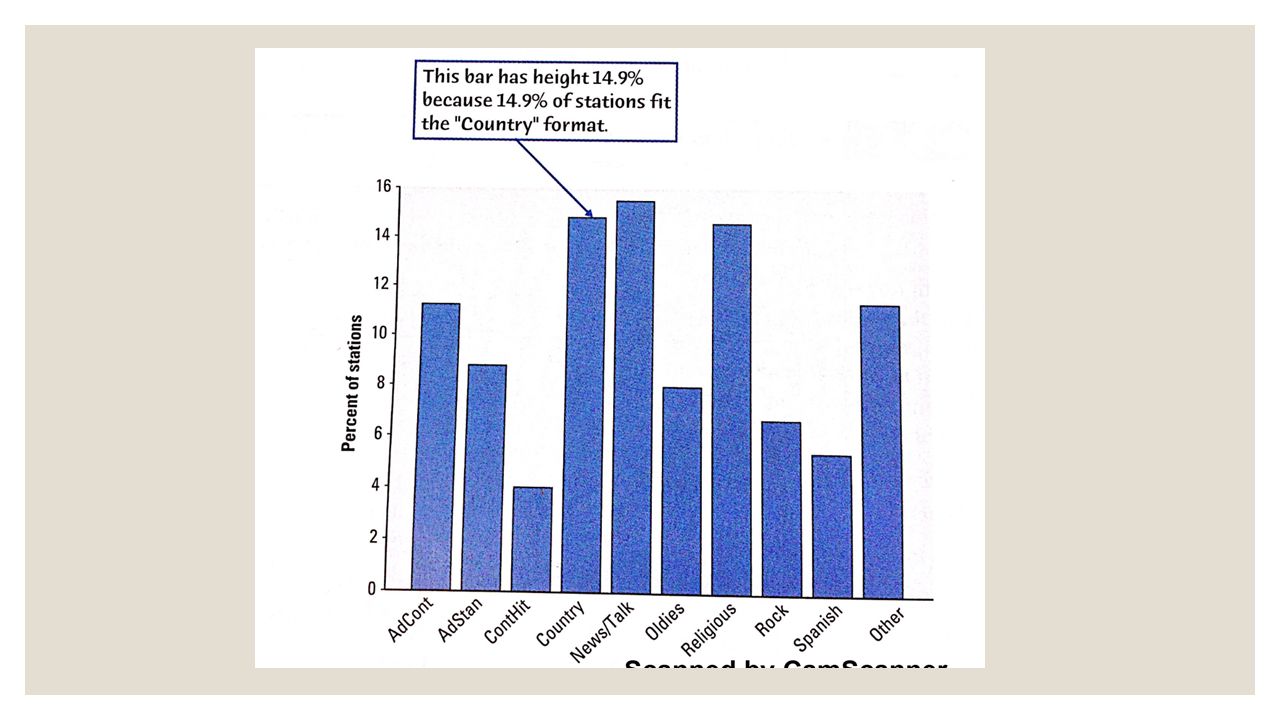
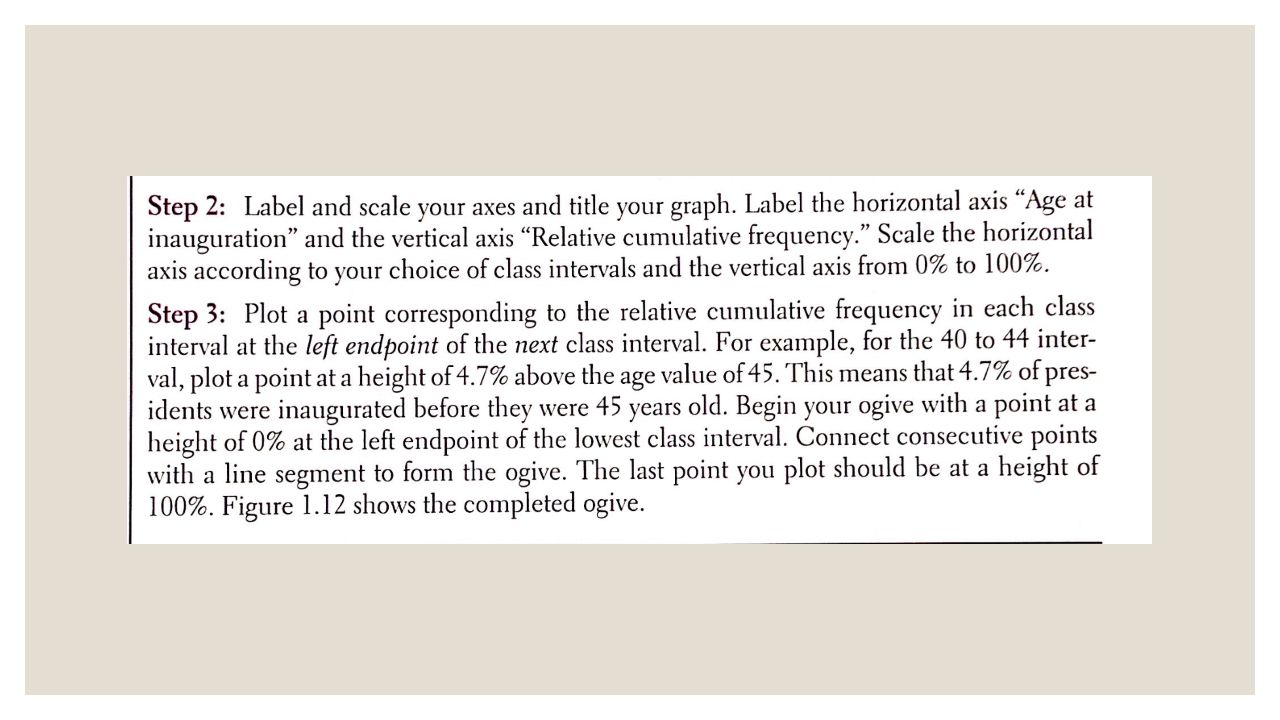
Summary ◦ Distribution ◦ Bar Graphs ◦ Pie Charts ◦ Stemplots ◦ Histograms ◦ Frequencies ◦ Shape ◦ Center ◦ Spread ◦ Deviations ◦ Symmetric ◦ Skewed ◦ Modes ◦ Outliers ◦ Relative Cumulative Frequency Graph (ogive) ◦ Time Plot
 ◦ Time Plot")
35
1-2 DESCRIBING DISTRIBUTIONS WITH NUMBERS

36
Measuring Center ◦ Mean vs Median ◦ Both are measures of the center of distribution ◦ Symmetric-Close together ◦ Skewed-Mean is farther out in the long tail than its median ◦ Mean-Average value of variable ◦ Median-Typical value of variable ◦ Mean-formula ◦ Sensitive to the influence of extreme observations (not always outliers!) ◦ The mean cannot resist the influence of extreme observations, we say it is not a resistant measure of center. ◦ Does more than limit the influence of outliers, its value does not respond strongly to changes in a few observations ◦ Median-formula ◦ More formal version of midpoint

37
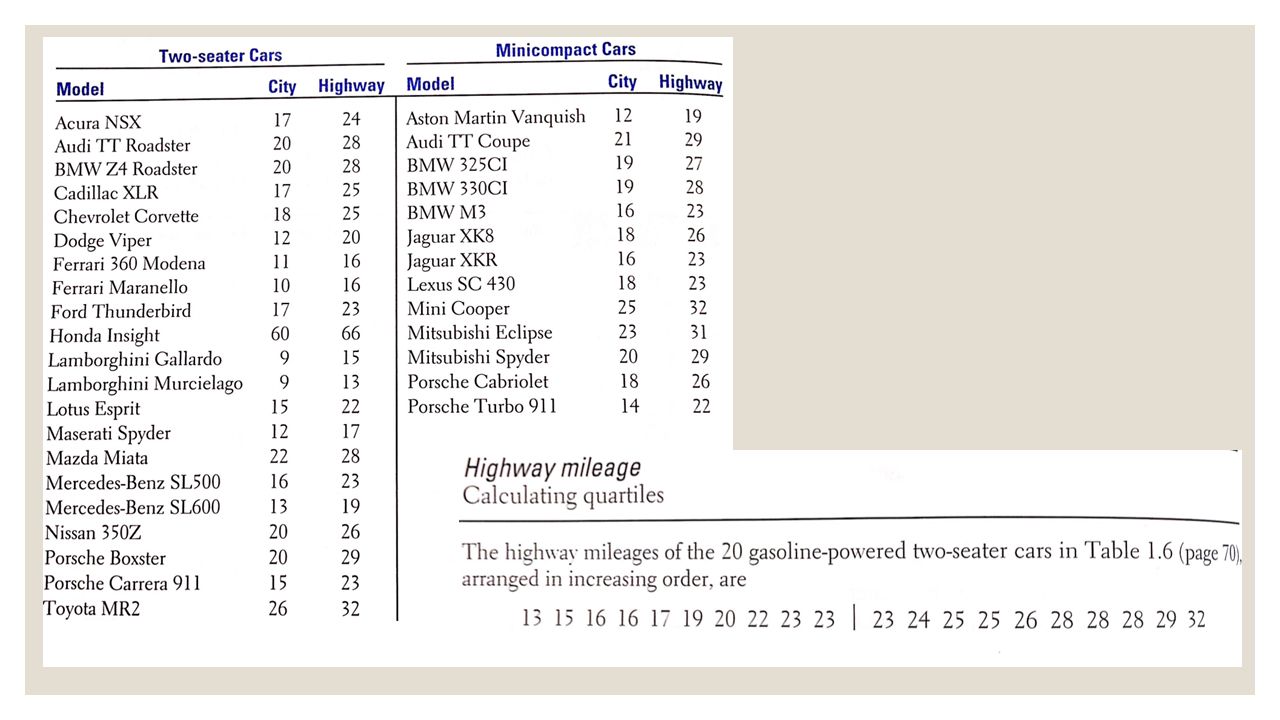
THE QUARTILES

38
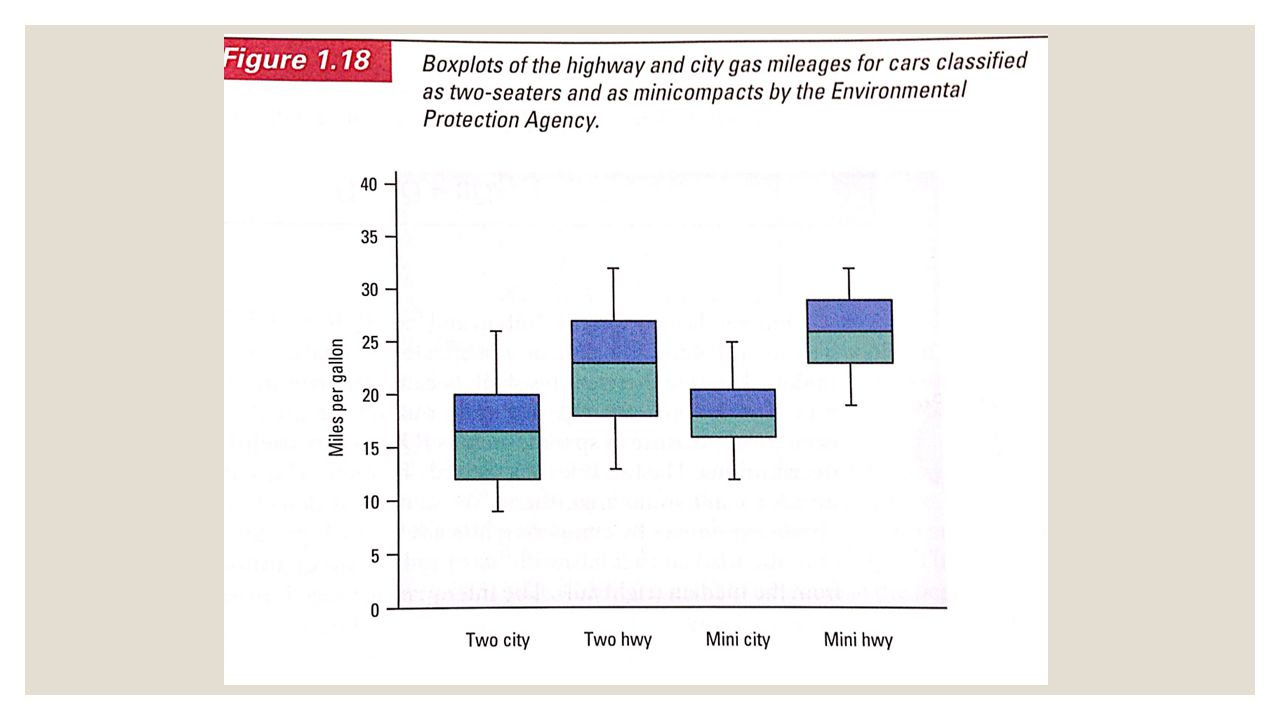
Spread or Varibility ◦ Range ◦ Pth percentile ◦ Quartiles (Q1 and Q3) ◦ Five Number Summary and Boxplots ◦ 1.5 x IQR: Identifies outliers
 ◦ Five Number Summary and Boxplots ◦ 1.5 x IQR: Identifies outliers")
41
Standard Deviation ◦ Measures spread by looking at how far the observations are from their mean ◦ Calculator

42
Choosing a Summary ◦ Which one best describes center and spread? ◦ Five-Number Summary ◦ Mean ◦ Standard Deviation

43
CHANGING THE UNIT OF MEASURE

44
Linear Transformation ◦ Miles and Fahrenheit vs KM and Celsius ◦ Linear Transformation : changes the original variable into the new variable by an equation ◦ Pg. 91 ◦ Adding a constant number to each data point ◦ Linear transformations do not change the shape of distribution ◦ Center and spread MAY change

45
Effect of a Linear Transformation ◦ Multiplying: positive b multiplies both center and spread ◦ Adding: same number a, adds a to measures of center, but does not change the spread (IQR and s)
")
Similar presentations


 Dotplot (also used for quantitative)>")


