Download presentation
Presentation is loading. Please wait.

1
Describing Distributions with Numbers

2
P. 64 13,18 P. 68 25

3
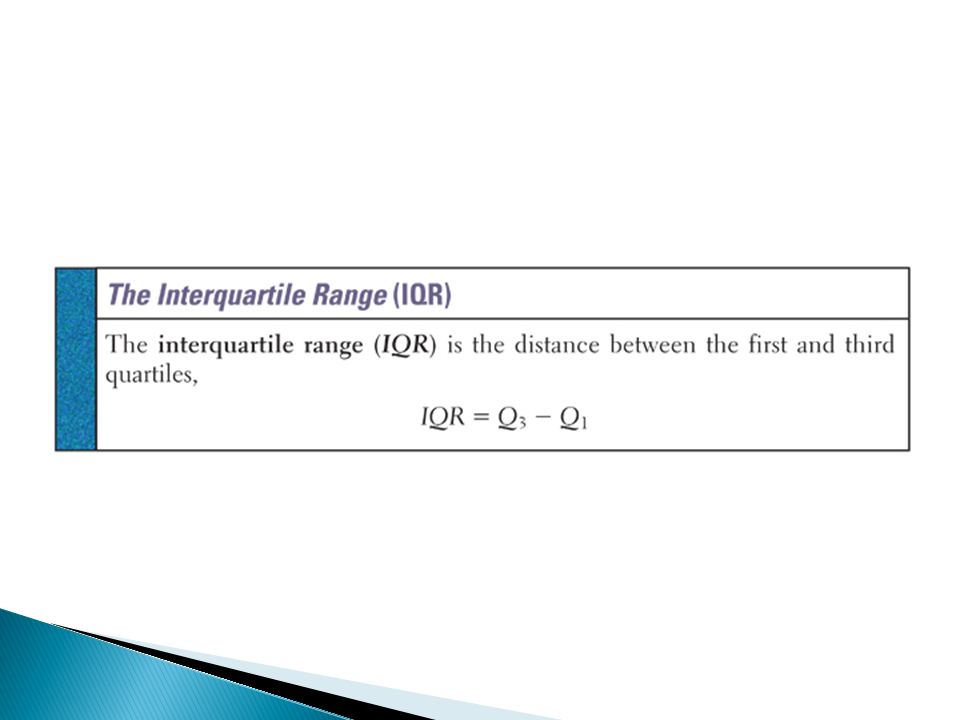
I. Measures of Center A. Mean B. Median C. Mean vs. Median II. Measures of Spread A. Quartiles B. Standard Deviation

5
154 109 137 115 152 140 154 178 101 103 126 126 137 165 165 129 200 148 A. Make a stemplot B. Enter Data into list and use 1-var stats to report SOCS C. Which is larger mean or median. Why?

7
Last year a small accounting firm paid each of its five clerks $22,000, two junior accountants $50,000 each, and the firm’s owner $270,000. A. What is the mean salary paid at this firm? B. What is the median salary paid at this firm? C. Describe how an unethical recruiter could use statistics to mislead prospective employees.

9
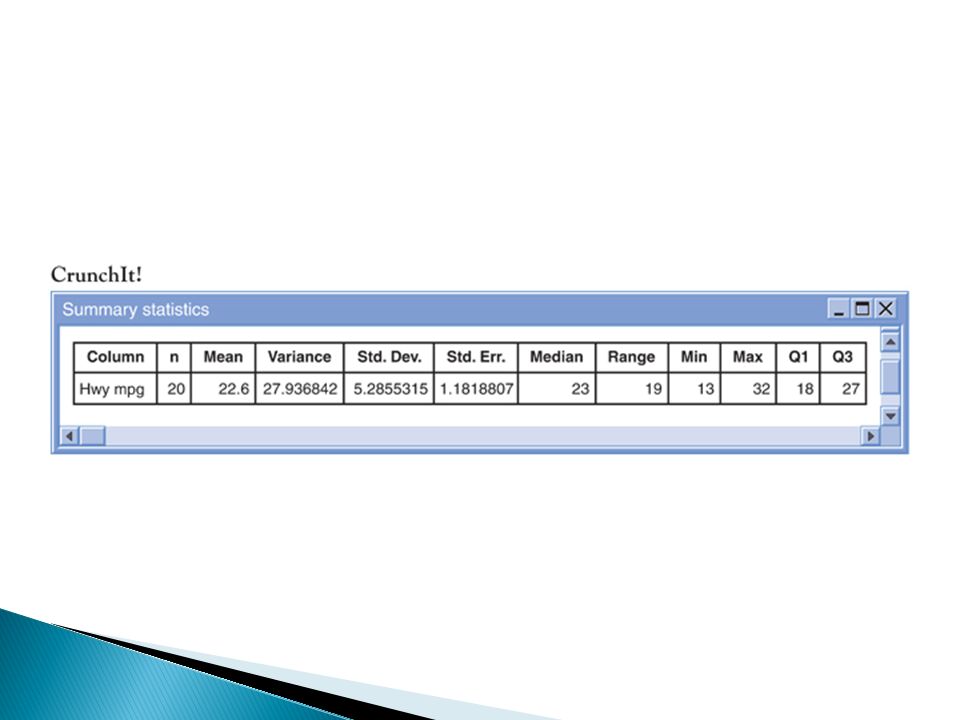
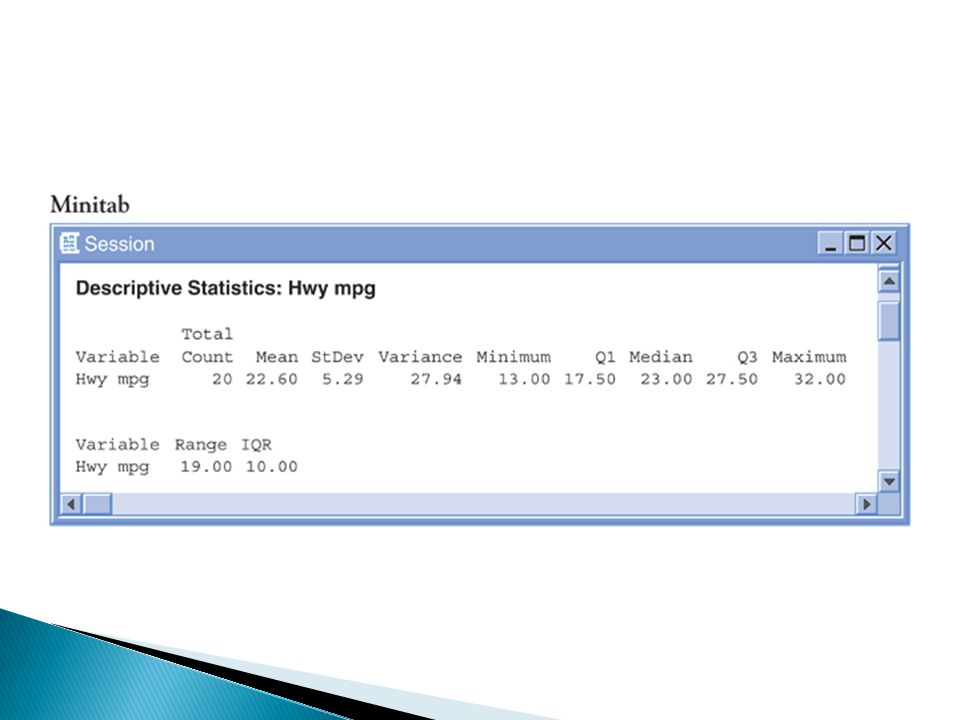
Find the median, 1 st quartile, 3 rd quartile by hand. Then repeat using calculator. 13 15 16 16 17 19 20 22 23 23 23 24 25 25 26 28 28 28 29 32

17
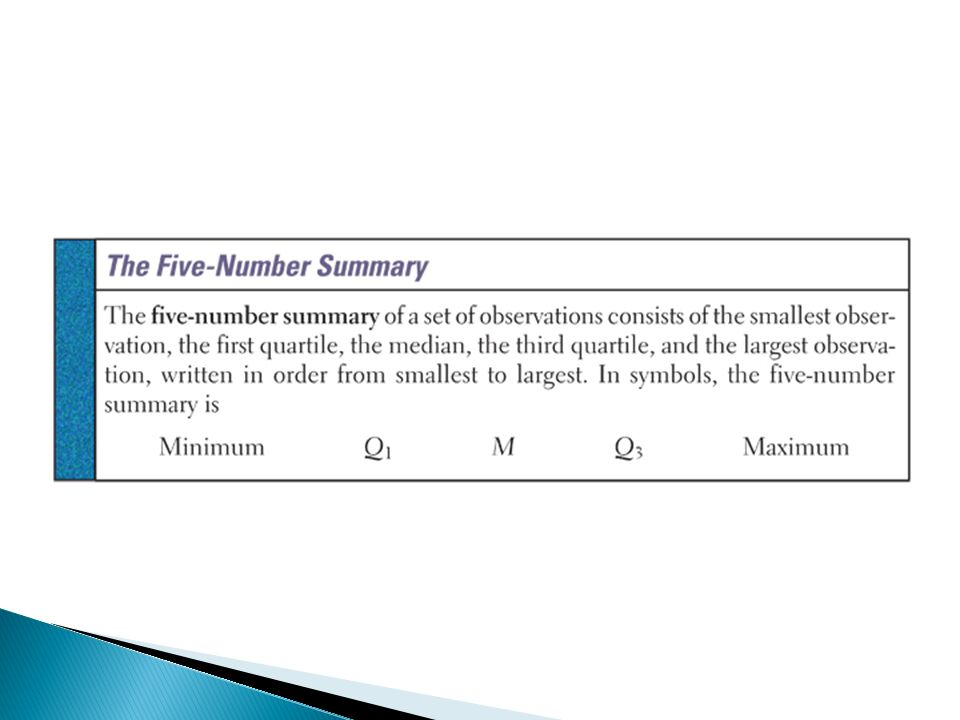
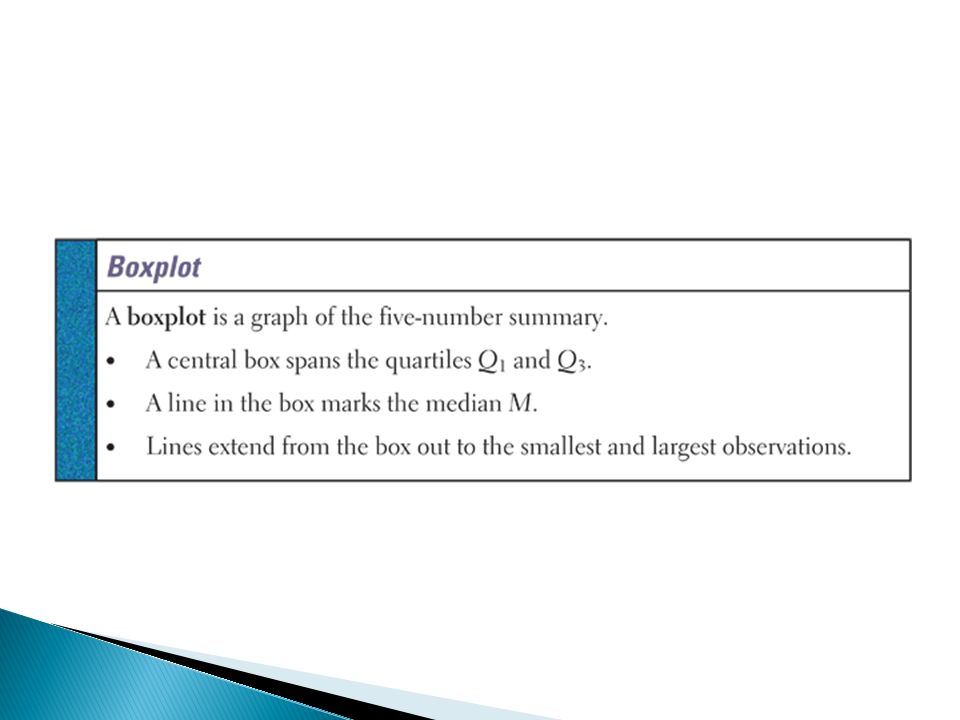
Ages of Presidents at Inauguration 57, 61,57,57, 58, 57, 61, 54, 68, 51 49, 64, 50, 48, 65, 52, 56, 46, 54, 49 51, 47, 55, 55, 54, 42, 51, 56, 55, 51, 54, 51, 60, 61, 43, 55, 56, 61, 52, 69, 64, 46, 54 A. Enter data and make a histogram on calculator B. Given shape of histogram how do you expect the mean and median to compare? C. Find the five number summary D. Construct a boxplot by hand and then on calculator E. Test for Outliers. F. If there are outliers make a modified boxplot

18
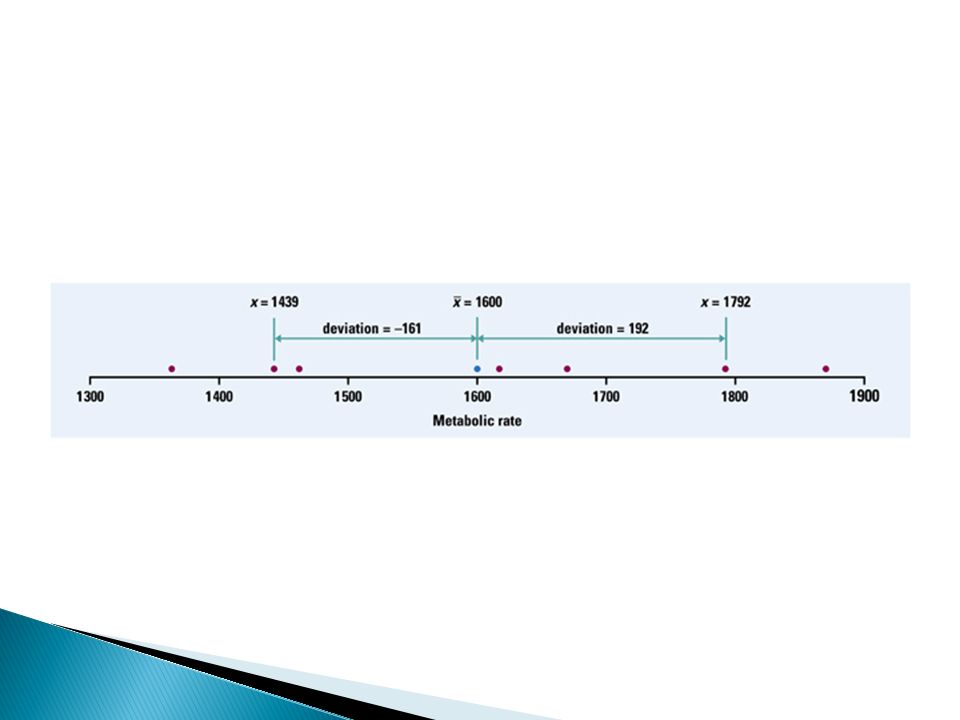
How far from the mean is a typical data value. Standard deviation is calculated using the mean so only report standard deviation for symmetric data

20
Calculate the mean and standard deviation of the metabolic rates by hand. Check your result using 1-var stats. 1792 1666 1614 1460 1867 1439

22
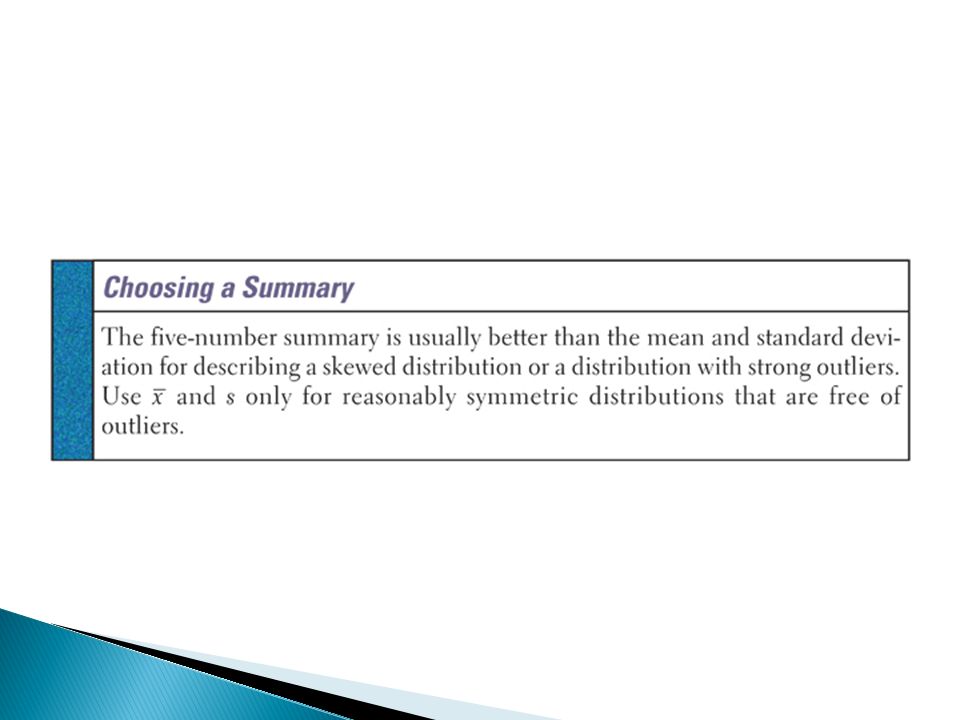
S measures spread about the mean – only used for symmetric data S = 0 only if the is NO spread (all data values the same) S, like the mean is not resistant (is sensitive) to outliers
 S, like the mean is not resistant (is sensitive) to outliers")
Similar presentations


 Used with medium or large size.>")


