Download presentation
Presentation is loading. Please wait.

1
Update on epidemiology of HIV in New Zealand Dr Sue McAllister AIDS Epidemiology Group (AEG) University of Otago Dunedin HIV Women’s Seminar Auckland, 24 June 2016
 University of Otago Dunedin HIV Women’s Seminar Auckland, 24 June 2016")
2
Overview of presentation Brief reminder about epidemiological surveillance and data sources Epidemiological pattern of those diagnosed with HIV in 2015 HIV in women Changes in data collection

3
Epidemiological surveillance

4
HIV data collection Enhanced HIV surveillance HIV “Diagnosis” = could have been first diagnosed in NZ or overseas Year of diagnosis may not reflect the year of infection

5
Annual numbers “diagnosed” with HIV in New Zealand by means of infection - 1985-2015 Includes all HIV cases (N=4392) found by Western Blot antibody (N=3551) and viral load testing (N=841) since 2002, and acquired in New Zealand and overseas.
 found by Western Blot antibody (N=3551) and viral load testing (N=841) since 2002, and acquired in New Zealand and overseas.")
6
Diagnosed with HIV in New Zealand in 2015 Men 205 (91.5%) Men 205 (91.5%) Women 18 (8.0%) Women 18 (8.0%) Transgender woman 1 (0.5%) Transgender woman 1 (0.5%) TOTAL 224 TOTAL 224
 Men 205 (91.5%) Women 18 (8.0%) Women 18 (8.0%) Transgender woman 1 (0.5%) Transgender woman 1 (0.5%) TOTAL 224 TOTAL 224")
7
Diagnosed with HIV in New Zealand in 2015 Men 205 (91.5%) Men 205 (91.5%) Women 18 (8.0%) Women 18 (8.0%) Transgender woman 1 (0.5%) Transgender woman 1 (0.5%) TOTAL 224 TOTAL 224 MSM – 153 (75%) MSM/IDU – 2 Heterosexual contact – 25 IDU – 3 Transfusion (overseas) – 1 Perinatal (overseas) – 1 Other/Unknown/Not stated – 20 MSM – 153 (75%) MSM/IDU – 2 Heterosexual contact – 25 IDU – 3 Transfusion (overseas) – 1 Perinatal (overseas) – 1 Other/Unknown/Not stated – 20
 Men 205 (91.5%) Women 18 (8.0%) Women 18 (8.0%) Transgender woman 1 (0.5%) Transgender woman 1 (0.5%) TOTAL 224 TOTAL 224 MSM – 153 (75%) MSM/IDU – 2 Heterosexual contact – 25 IDU – 3 Transfusion (overseas) – 1 Perinatal (overseas) – 1 Other/Unknown/Not stated – 20 MSM – 153 (75%) MSM/IDU – 2 Heterosexual contact – 25 IDU – 3 Transfusion (overseas) – 1 Perinatal (overseas) – 1 Other/Unknown/Not stated – 20")
8
Diagnosed with HIV in New Zealand in 2015 Men 205 (91.5%) Men 205 (91.5%) Women 18 (8.0%) Women 18 (8.0%) Transgender woman 1 (0.5%) Transgender woman 1 (0.5%) TOTAL 224 TOTAL 224 MSM – 153 (75%) MSM/IDU – 2 Heterosexual contact – 25 IDU – 3 Transfusion (overseas) – 1 Perinatal (overseas) – 1 Other/Unknown/Not stated – 20 MSM – 153 (75%) MSM/IDU – 2 Heterosexual contact – 25 IDU – 3 Transfusion (overseas) – 1 Perinatal (overseas) – 1 Other/Unknown/Not stated – 20 Heterosexual contact – 17 (94%) IDU – 1 Heterosexual contact – 17 (94%) IDU – 1
 Men 205 (91.5%) Women 18 (8.0%) Women 18 (8.0%) Transgender woman 1 (0.5%) Transgender woman 1 (0.5%) TOTAL 224 TOTAL 224 MSM – 153 (75%) MSM/IDU – 2 Heterosexual contact – 25 IDU – 3 Transfusion (overseas) – 1 Perinatal (overseas) – 1 Other/Unknown/Not stated – 20 MSM – 153 (75%) MSM/IDU – 2 Heterosexual contact – 25 IDU – 3 Transfusion (overseas) – 1 Perinatal (overseas) – 1 Other/Unknown/Not stated – 20 Heterosexual contact – 17 (94%) IDU – 1 Heterosexual contact – 17 (94%) IDU – 1")
9
Diagnosed with HIV in New Zealand in 2015 Men 205 (91.5%) Men 205 (91.5%) Women 18 (8.0%) Women 18 (8.0%) Transgender woman 1 (0.5%) Transgender woman 1 (0.5%) TOTAL 224 TOTAL 224 MSM – 153 (75%) MSM/IDU – 2 Heterosexual contact – 25 IDU – 3 Transfusion (overseas) – 1 Perinatal (overseas) – 1 Other/Unknown/Not stated – 20 MSM – 153 (75%) MSM/IDU – 2 Heterosexual contact – 25 IDU – 3 Transfusion (overseas) – 1 Perinatal (overseas) – 1 Other/Unknown/Not stated – 20 Heterosexual contact – 17 (94%) IDU – 1 Heterosexual contact – 17 (94%) IDU – 1 Sexual contact with a man
 Men 205 (91.5%) Women 18 (8.0%) Women 18 (8.0%) Transgender woman 1 (0.5%) Transgender woman 1 (0.5%) TOTAL 224 TOTAL 224 MSM – 153 (75%) MSM/IDU – 2 Heterosexual contact – 25 IDU – 3 Transfusion (overseas) – 1 Perinatal (overseas) – 1 Other/Unknown/Not stated – 20 MSM – 153 (75%) MSM/IDU – 2 Heterosexual contact – 25 IDU – 3 Transfusion (overseas) – 1 Perinatal (overseas) – 1 Other/Unknown/Not stated – 20 Heterosexual contact – 17 (94%) IDU – 1 Heterosexual contact – 17 (94%) IDU – 1 Sexual contact with a man")
10
Annual numbers of MSM diagnosed with HIV in New Zealand, 1996-2015 by place of infection. Includes HIV cases diagnosed by +ve Western Blot antibody test and viral load testing

11
Initial CD4 count among MSM infected in New Zealand Increase in the number of diagnoses with a CD4 count >500 that has persisted in 2015 compared to the period 2010-2013 suggests higher incidence in recent years. More “late diagnoses” may be a result of focused HIV testing in early 2015

12
Age of all MSM “diagnosed” – 2015 (Range 18-80 years)
")
13
Ethnicity of all MSM “diagnosed” - 2015

14
Place of residence of MSM “diagnosed” - 2015

15
Annual numbers heterosexually acquired HIV diagnosed in New Zealand - 1996-2015. Includes HIV cases diagnosed by +ve Western Blot antibody test and viral load testing

16
Age of all heterosexually infected “diagnosed” – 2015 (Range 23-68 years)
")
17
Ethnicity of all men and women heterosexually “diagnosed” in New Zealand – 2015

18
Initial CD4 count of men and women heterosexually infected in New Zealand – 2010- 2015 MenWomen No. % % <3501648%2250% 350-499618%8 500 or more1133%1432% Unknown33 Total3647

19
Initial CD4 count of men and women heterosexually and MSM infected in New Zealand – 2010-2015 MenWomenMSM No. % % % <3501648%2250% 142 35% 350-499618%8 94 23% 500 or more 1133%1432% 172 42% Unknown33 32 Total3647440 Greater proportion of late diagnosed among those heterosexually infected compared to MSM

20
People who inject drugs (PWID) – 2015 Four (3 men and 1 women) reported infected through IDU in 2015 2 in New Zealand, 2 overseas + 2 MSM who might have been infected through IDU or sex with other men
 – 2015 Four (3 men and 1 women) reported infected through IDU in in New Zealand, 2 overseas + 2 MSM who might have been infected through IDU or sex with other men")
21
Mother to child transmission (MTCT) – 2015 One child diagnosed in 2015 infected through MTCT o Born in Africa in 2006 No child with diagnosed perinatal HIV born since 2007 o But there may be children living with undiagnosed HIV o Child born in New Zealand in 2006 recently diagnosed in Australia 6 births to women with diagnosed HIV in 2015 o No HIV infections in the 134 births to such women since 1998 3 pregnant women diagnosed with HIV in 2015
 – 2015 One child diagnosed in 2015 infected through MTCT o Born in Africa in 2006 No child with diagnosed perinatal HIV born since 2007 o But there may be children living with undiagnosed HIV o Child born in New Zealand in 2006 recently diagnosed in Australia 6 births to women with diagnosed HIV in 2015 o No HIV infections in the 134 births to such women since pregnant women diagnosed with HIV in 2015")
22
Pharmac data on number of people on subsidised ART at June each year and total annual cost Care with these data as eligibility for ART changed These data some idea on prevalence not incidence If 85% of diagnosed adults on subsidised ART, approx. 2400 adults in New Zealand with diagnosed HIV at (end June 2015) If 80% all with HIV diagnosed, approx. 3000 adults living with HIV in New Zealand (end June 2015)
 If 80% all with HIV diagnosed, approx adults living with HIV in New Zealand (end June 2015).")
23
Overview of presentation Brief reminder about epidemiological surveillance and data sources Epidemiological pattern of those diagnosed with HIV in 2015 HIV in women Changes in data collection

24
Annual number of women “diagnosed” with HIV in New Zealand – 1985-2015 (n=676)
")
25
Means of infection of women diagnosed with HIV - 1985-2015

26
Age of women “diagnosed” with HIV in New Zealand – 1985-2015

27
Annual numbers of women diagnosed with HIV in New Zealand, 1996-2015 by place of infection

28
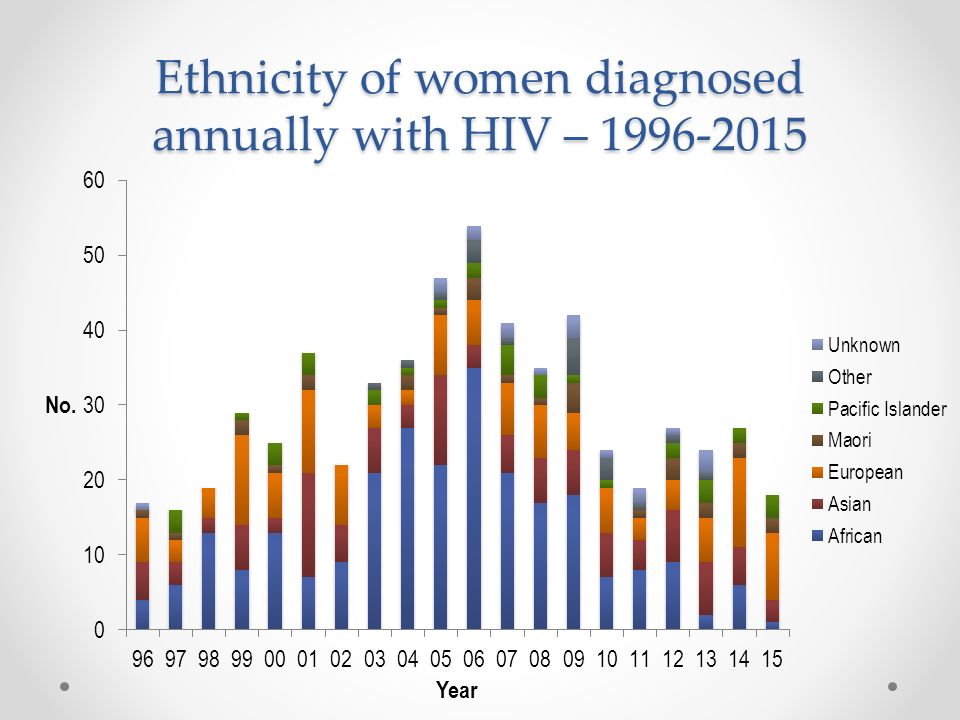
Ethnicity of women diagnosed annually with HIV – 1996-2015

30
Place of residence of women diagnosed with HIV – 1996-2015

31
Overview of presentation Brief reminder about epidemiological surveillance and data sources Epidemiological pattern of those diagnosed with HIV in 2015 HIV in women Changes in data collection

32
Cornerstone of epidemiological surveillance of the HIV/AIDS epidemic in New Zealand is the collection of information on all cases of diagnosed HIV as recommended by UNAIDS. Currently collect data from laboratories and clinicians using the AIDS code.

33
Changes in data collection Health Protection Amendment Bill – going through 3 rd Reading in Parliament HIV notifiable National Health Index (NHI) number Ensure protection and continuity of HIV data collection Ensure better data completion rates Allow for “monitoring of care” of people diagnosed with HIV
 number Ensure protection and continuity of HIV data collection Ensure better data completion rates Allow for monitoring of care of people diagnosed with HIV")
34
Spectrum of engagement of care in the US, 2010 (Gardner et al. 2011)
")
35
Importantly….. No identifiable information! Database would continue to be kept secure! No change to individuals being diagnosed with HIV

36
Acknowledgments Past and present members of AEG Infectious disease and SHCs clinicians and their support staff, and GPs Laboratories and their staff NZAF and other NGOs Gay Men’s Health Group Ministry of Health ASHM and other sponsors of the HIV Updates

Similar presentations

>")
 Public Health England London,>")

 and Men Who Have Sex with Men and Women (MSMW), Georgia, 2012.>")


, Georgia, 2012.>")
