Download presentation
Presentation is loading. Please wait.

1
B121 Chapter 6 Effective Ways of Displaying Information

5
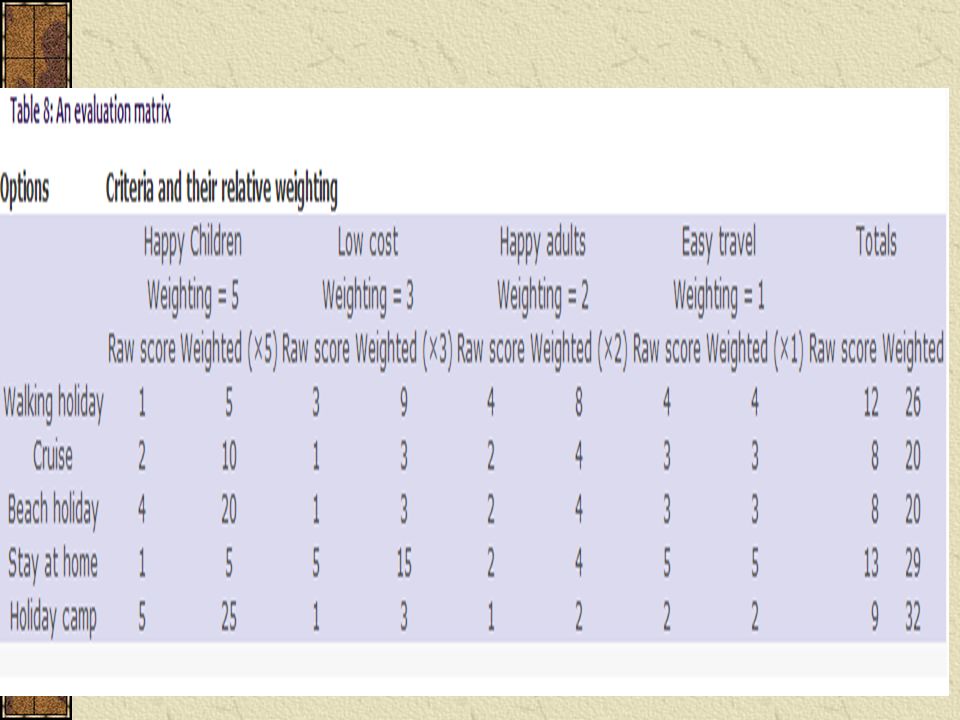
Matrices A matrix is an arrangement of ‘cells’ in rows and columns. A spreadsheet is a simple example of a matrix. The size of a matrix is described by the number of rows and the number of columns (in that order). A ‘two-by-two’ matrix has two rows and two columns. A ‘three-by-two’ matrix has three rows and two columns.
. A ‘two-by-two’ matrix has two rows and two columns. A ‘three-by-two’ matrix has three rows and two columns..")
7
Force-field diagrams A force-field diagram shows the opposing pressures (or forces) that are bearing on a situation. Within the context of planning and managing change, the diagram shows the forces which are supportive of change (the driving forces) and the forces which are likely to be unhelpful or resistant (the restraining forces).
 and the forces which are likely to be unhelpful or resistant (the restraining forces)..")
8
General force-field diagram

9
How a force-field diagram can help The diagram is a useful expositional or presentational device. When you are presenting an analysis or proposal, the diagram will enable you to describe (and distinguish between) the reasons for a change. It will enable you to do the same for the reasons why a change may be resisted. The diagram will be an explicit prompt for exploring the restraining forces. The more a manager finds out about these, and the earlier, the better placed the manager will be to find a way to deal with them. The idea of the restraining forces reminds a manager to look for and identify them.
 the reasons for a change. It will enable you to do the same for the reasons why a change may be resisted. The diagram will be an explicit prompt for exploring the restraining forces. The more a manager finds out about these, and the earlier, the better placed the manager will be to find a way to deal with them. The idea of the restraining forces reminds a manager to look for and identify them..")
10
Input-output diagrams An input-output diagram shows the inputs to a system or to an operation and the outputs from it.

11
First diagram

12
Second diagram

13
Influence diagrams An influence diagram shows the influences, from within the organisation or from outside it, which bear on a person or unit.

14
The model

15
Systems thinking ‘The whole is more than the sum of its parts’ is a good place to start thinking about systems. A car is more than its individual components. We can think of a football team as being more than a collection of individual players or a family being more than a group of people who share the same name. Each of these examples – the car, the football team and the family – can be seen as systems. Individual parts of a system are connected together in some way for a purpose.

16
Five key ideas about systems Everything in a system is connected A system does something Systems have a boundary and an environment The system is defined by your interest Systems and subsystems

17
A systems map

18
Important points about systems maps A system map shows the boundary of the system and the different subsystems inside the boundary. It may also show important influences outside the boundary, that is, in the external environment. A map is a map. It does not have arrows showing relationships or influences between the subsystems. The scale and the detail depend on the purpose of the system map. Keep the map as simple as possible to aid clarity. Ensure the map is clearly labelled. All boundaries and subsystems need to be clearly identified.

19
Important points about systems maps In changing a system, we have to draw the existing real-life system and the new system we would wish it to be. To transform the existing system into the new one requires systems interventions.

20
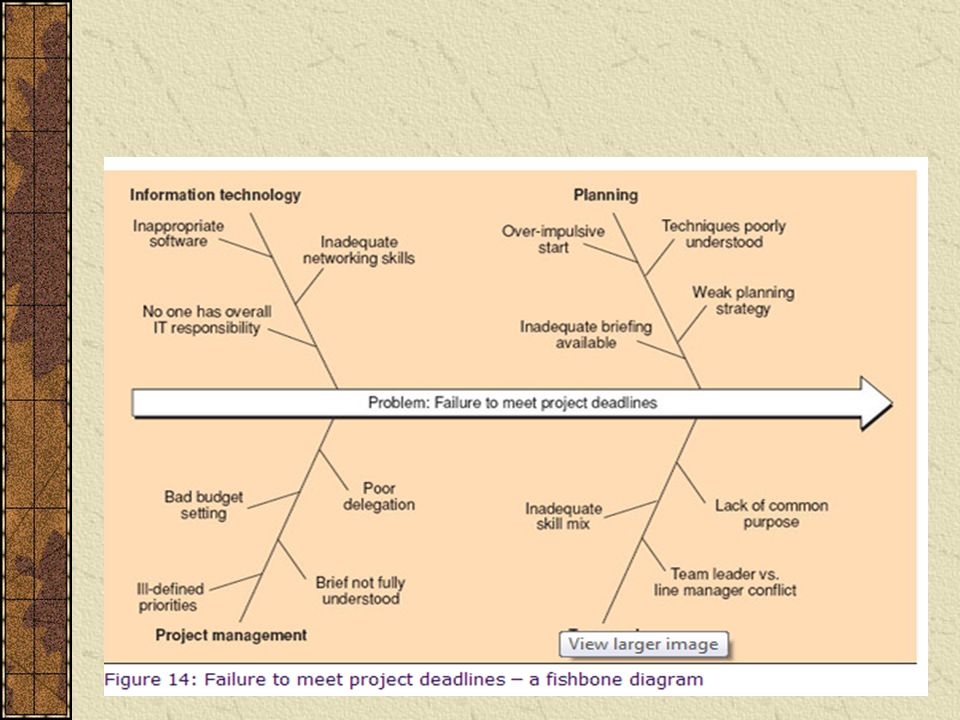
Fishbone diagram There are times when management problems seem too complicated and ‘messy’ to analyse. A technique, the fishbone diagram, can be used by both individuals and groups to help to clarify the causes of a difficult problem and capture its complexity. The diagram will help provide a comprehensive and balanced picture and show the relative importance and interrelationships between different parts of the problem.

22
Mind mapping The term mind mapping was devised by Tony Buzan for the representation of such things as ideas, notes and information, in radial tree diagrams — sometimes also called spider diagrams. These are now very widely used — try a web search on ‘Buzan’, ‘mind map’ or ‘concept map’.

24
Multiple-cause diagrams As a general rule, an event or outcome will have more than one cause. A multiple-cause diagram will enable you to show the causes and the ways in which they are connected. Suppose, for example, that you were asked to explain why a work group was under- performing. You could use a multiple-cause diagram both to help you to construct the explanation and to present it.

26
Network analysis Network analysis (or critical path analysis) seeks to overcome that drawback, particularly where large or specialist projects are concerned. The critical path is found as a result of the analysis of the network. There are many computer software packages which can help a manager to carry out a network analysis.

27
Case study

Similar presentations


 Squares (external agents) Open-ended boxes (data stores) Arrows.>")
 Main Principles: systems thinking.>")


Systems Theory1 Supplement 02 (a) Systems Theory And Franchise Colleges By MANSHA NAWAZ.>")


