Download presentation
Presentation is loading. Please wait.

1
HYDROGRAPHS: CONSTRUCTION AND ANALYSIS 01/10/2016

2
LESSON AIMS To find out how to construct a hydrograph. To find out how to read and analyse a hydrograph.

3
Construction And Analysis of Hydrographs ©Microsoft Word clipart

4
WHAT IS A HYDROGRAPH? Look at the hydrograph: What do you think that it shows?

6
WHAT IS A HYDROGRAPH? Hydrographs can look very complex but when you learn to read them they are relatively straight forward to analyse.

7
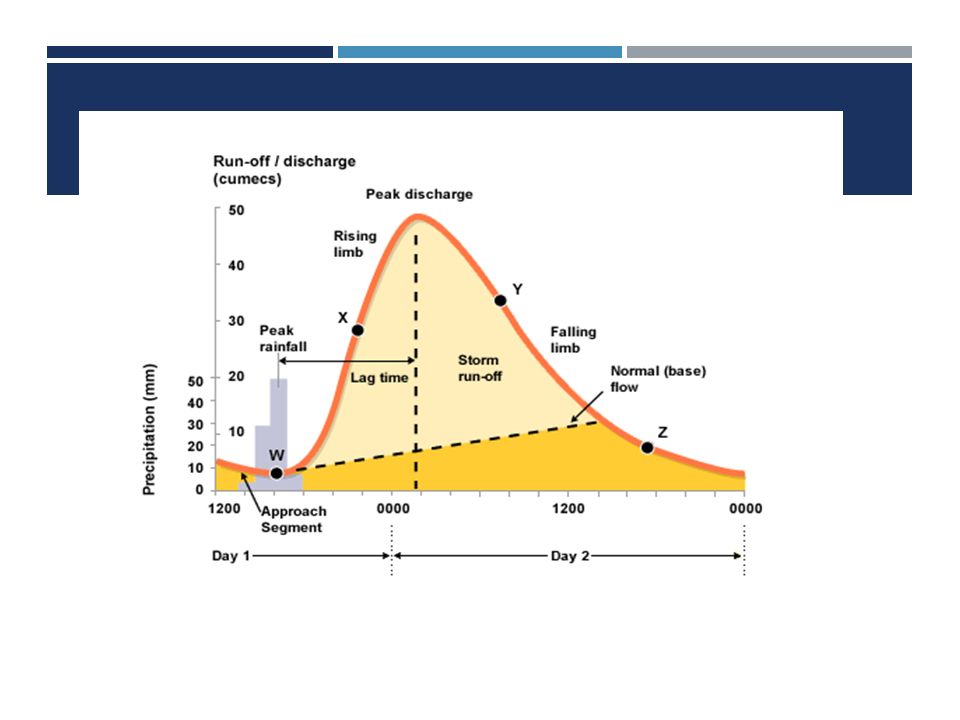
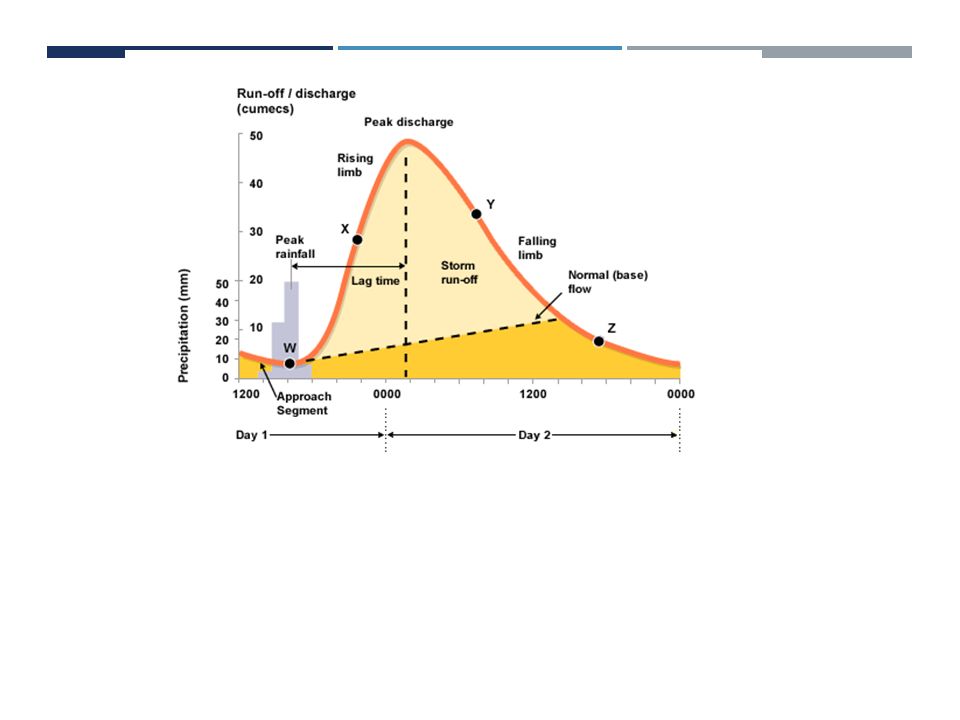
WHAT IS A HYDROGRAPH? A hydrograph is a graph showing the rate of flow (discharge) versus time past a specific point in a river. It really shows two graphs – one showing precipitation and one showing discharge.
 versus time past a specific point in a river. It really shows two graphs – one showing precipitation and one showing discharge..")
8
Hydrograph Record of River Discharge over a period of time River Discharge = cross sectional area rivers mean (average) velocity X (at a particular point in its course) Storm Hydrographs Show the change in discharge caused by a period of rainfall
 velocity X (at a particular point in its course) Storm Hydrographs Show the change in discharge caused by a period of rainfall")
9
Why Construct & Analyse Hydrographs ? To find out discharge patterns of a particular drainage basin Help predict flooding events, therefore influence implementation of flood prevention measures ©Microsoft Word clipart

10
Construction Of Storm (flood) Hydrographs ©Microsoft Word clipart
 Hydrographs ©Microsoft Word clipart")
11
0 12 24 36 48 30 72 Hours from start of rain storm 3 2 1 Discharge (m 3 /s)
")
12
0 12 24 36 48 30 72 Hours from start of rain storm 3 2 1 Discharge (m 3 /s) mm 4 3 2 Rainfall shown in mm, as a bar graph
 mm Rainfall shown in mm, as a bar graph")
13
0 12 24 36 48 30 72 Hours from start of rain storm 3 2 1 Discharge (m 3 /s) mm 4 3 2 Discharge in m 3 /s, as a line graph
 mm Discharge in m 3 /s, as a line graph")
14
0 12 24 36 48 30 72 Hours from start of rain storm 3 2 1 Discharge (m 3 /s) Rising limb mm 4 3 2 Rising limb The rising flood water in the river
 Rising limb mm Rising limb The rising flood water in the river")
15
0 12 24 36 48 30 72 Hours from start of rain storm 3 2 1 Discharge (m 3 /s) Rising limb mm 4 3 2 Peak flow Maximum discharge in the river
 Rising limb mm Peak flow Maximum discharge in the river")
16
0 12 24 36 48 30 72 Hours from start of rain storm 3 2 1 Discharge (m 3 /s) Rising limb Recession limb mm 4 3 2 Peak flow Recession limb Falling flood water in the river
 Rising limb Recession limb mm Peak flow Recession limb Falling flood water in the river")
17
0 12 24 36 48 30 72 Hours from start of rain storm 3 2 1 Discharge (m 3 /s) Rising limb Recession limb Basin lag time mm 4 3 2 Peak flow Basin lag time Time difference between the peak of the rain storm and the peak flow of the river
 Rising limb Recession limb Basin lag time mm Peak flow Basin lag time Time difference between the peak of the rain storm and the peak flow of the river")
18
0 12 24 36 48 30 72 Hours from start of rain storm 3 2 1 Discharge (m 3 /s) Base flow Rising limb Recession limb Basin lag time mm 4 3 2 Peak flow Base flow Normal discharge of the river
 Base flow Rising limb Recession limb Basin lag time mm Peak flow Base flow Normal discharge of the river")
19
0 12 24 36 48 30 72 Hours from start of rain storm Complete storm hydrograph in small stream channel. - YouTube 3 2 1 Discharge (m 3 /s) Base flow Through flow Overland flow Rising limb Recession limb Basin lag time mm 4 3 2 Peak flow Overland flow Through flow + = Storm Flow
 Base flow Through flow Overland flow Rising limb Recession limb Basin lag time mm Peak flow Overland flow Through flow + = Storm Flow.")
20
Volume of water reaching the river from surface run off Overland flowThrough flow Volume of water reaching the river through the soil and underlying rock layers

21
0 12 24 36 48 30 72 Hours from start of rain storm 3 2 1 Discharge (m 3 /s) Base flow Through flow Overland flow Rising limb Recession limb Basin lag time mm 4 3 2 Peak flow Flood Hydrograph
 Base flow Through flow Overland flow Rising limb Recession limb Basin lag time mm Peak flow Flood Hydrograph")
22
0 12 24 36 48 60 72 Hours from start of rain storm 3 2 1 Discharge (m 3 /s) Base flow Through flow Overland flow Rising limb Recession limb Basin lag time mm 4 3 2 Peak flow Flood Hydrograph
 Base flow Through flow Overland flow Rising limb Recession limb Basin lag time mm Peak flow Flood Hydrograph")
23
DESCRIBING HYDROGRAPHS:.

24
Q) Describe the hydrograph that you have been given in detail.
 Describe the hydrograph that you have been given in detail.")
25
DESCRIBING HYDROGRAPHS: Q) Describe the hydrograph that you have been given in detail. 2 minutes: Don’t write anything just discuss what you think you would say and be ready to feed back. 5 minutes – now write your answer down.

26
DESCRIPTION OF A HYDROGRAPH: JUST SAY WHAT YOU CAN SEE.

27
Precipitation starts just before 14.00hrs on day one, with the peak rainfall occurring at 16.00hrs at around 50mm. There is a very steep rising limb leading to a peak discharge of 50 cumecs. The lag time is around 10 hours.

28
The falling limb is also steep, returning to the normal base flow at around 14.00hrs on day 2. The discharge returns to around 5 cumecs at the end of day 2.

29
IMPORTANT! It is very unlikely that you will simply be asked to describe a hydrograph (mainly because there is not enough marks to talk about). You must be able to analyse the hydrograph.
. You must be able to analyse the hydrograph..")
30
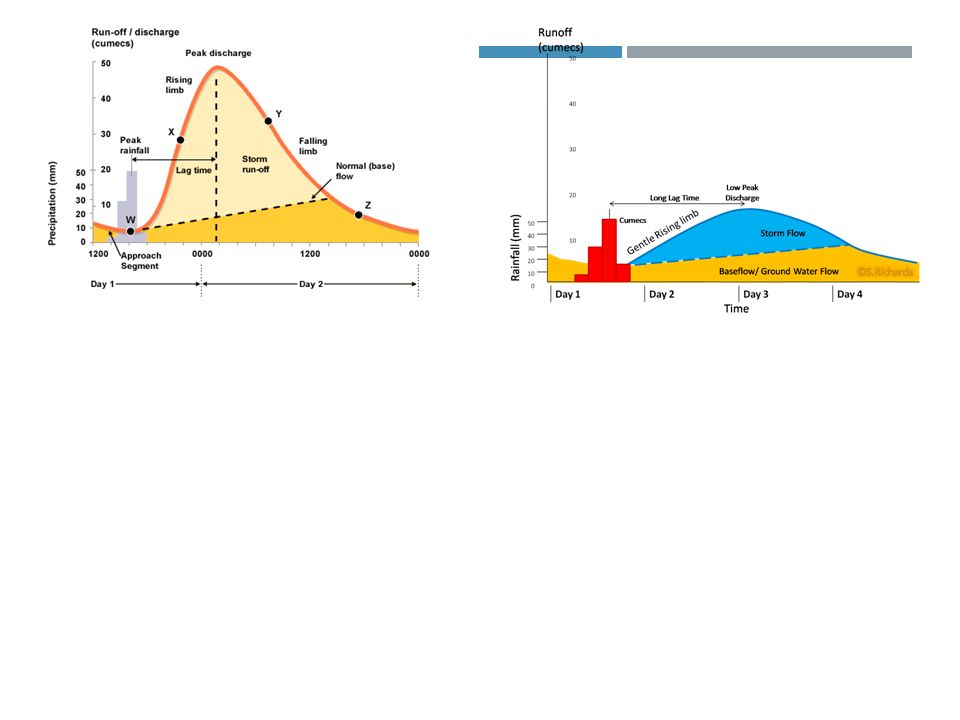
Hydrographs can look very different depending on how a number of factors affect the drainage basin. Some hydrographs have a very steep sharp rising and falling limbs while others have a more gentle profile.

31
Analysis ©Microsoft Word clipart

32
Factors influencing Storm Hydrographs Area Shape Slope Rock Type Soil Land Use Drainage Density Precipitation / Temp Tidal Conditions ©Microsoft Word clipart

33
Interpretation of Storm Hydrographs Rainfall Intensity Rising Limb Recession Limb Lag time Peak flow compared to Base flow Recovery rate, back to Base flow You need to refer to: Basin lag time 0 12 24 36 48 30 72 Hours from start of rain storm 3 2 1 Discharge (m 3 /s) Base flow Through flow Overland flow Rising limb Recession limb mm 4 3 2 Peak flow
 Base flow Through flow Overland flow Rising limb Recession limb mm Peak flow")
34
When interpreting hydrographs all factors must be considered together ! Here are some theoretical interpretations of influencing factors BUT…… ©Microsoft Word clipart

35
Area Large basins receive more precipitation than small therefore have larger runoff Larger size means longer lag time as water has a longer distance to travel to reach the trunk river AreaRock TypeDrainage Density ShapeSoilPrecipitation / Temp SlopeLand UseTidal Conditions

36
Shape Elongated basin will produce a lower peak flow and longer lag time than a circular one of the same size AreaRock TypeDrainage Density ShapeSoilPrecipitation / Temp SlopeLand UseTidal Conditions

38
Slope Channel flow can be faster down a steep slope therefore steeper rising limb and shorter lag time AreaRock TypeDrainage Density ShapeSoilPrecipitation / Temp SlopeLand UseTidal Conditions

39
Rock Type Permeable rocks mean rapid infiltration and little overland flow therefore shallow rising limb AreaRock TypeDrainage Density ShapeSoilPrecipitation / Temp SlopeLand UseTidal Conditions

40
Soil Infiltration is generally greater on thick soil, although less porous soils eg. clay act as impermeable layers The more infiltration occurs the longer the lag time and shallower the rising limb AreaRock TypeDrainage Density ShapeSoilPrecipitation / Temp SlopeLand UseTidal Conditions

41
Land Use Urbanisation - concrete and tarmac form impermeable surfaces, creating a steep rising limb and shortening the lag time Afforestation - intercepts the precipitation, creating a shallow rising limb and lengthening the lag time AreaRock TypeDrainage Density ShapeSoilPrecipitation / Temp SlopeLand UseTidal Conditions

42
Drainage Density A higher density will allow rapid overland flow AreaRock TypeDrainage Density ShapeSoilPrecipitation / Temp SlopeLand UseTidal Conditions

43
Precipitation & Temperature Short intense rainstorms can produce rapid overland flow and steep rising limb If there have been extreme temperatures, the ground can be hard (either baked or frozen) causing rapid surface run off Snow on the ground can act as a store producing a long lag time and shallow rising limb. Once a thaw sets in the rising limb will become steep AreaRock TypeDrainage Density ShapeSoilPrecipitation / Temp SlopeLand UseTidal Conditions

44
Tidal Conditions High spring tides can block the normal exit for the water, therefore extending the length of time the river basin takes to return to base flow AreaRock TypeDrainage Density ShapeSoilPrecipitation / Temp SlopeLand UseTidal Conditions

45
Remember! These influencing factors will: Influence each other Change throughout the rivers course ©Microsoft Word clipart

49
RE-CAP QUESTIONS FOR HYDROGRAPHS Look at the Hydrograph in front of you and answer the following questions. 1. Describe and account for the changes in discharge for this flood hydrograph 5 marks 2. Explain the physical factors of the area that you would expect with this type of hydrograph.5 marks

50
RE-CAP QUESTIONS FOR HYDROGRAPHS Look at the Hydrograph in front of you and answer the following questions. 1. Describe and account for the changes in discharge for this flood hydrograph 5 marks 2. Explain the physical factors of the area that you would expect with this type of hydrograph.5 marks

51
PAST PAPER QUESTION

Similar presentations


>")


The following points should be mentioned in your answers; –Water flows through the system.>")
 GCSE Geography Theme 2 Topic 2 Click to continue Hodder Education Revision Lessons Understanding hydrographs.>")


