Download presentation
Presentation is loading. Please wait.

1
INTRODUCTION TO FLOODING

2
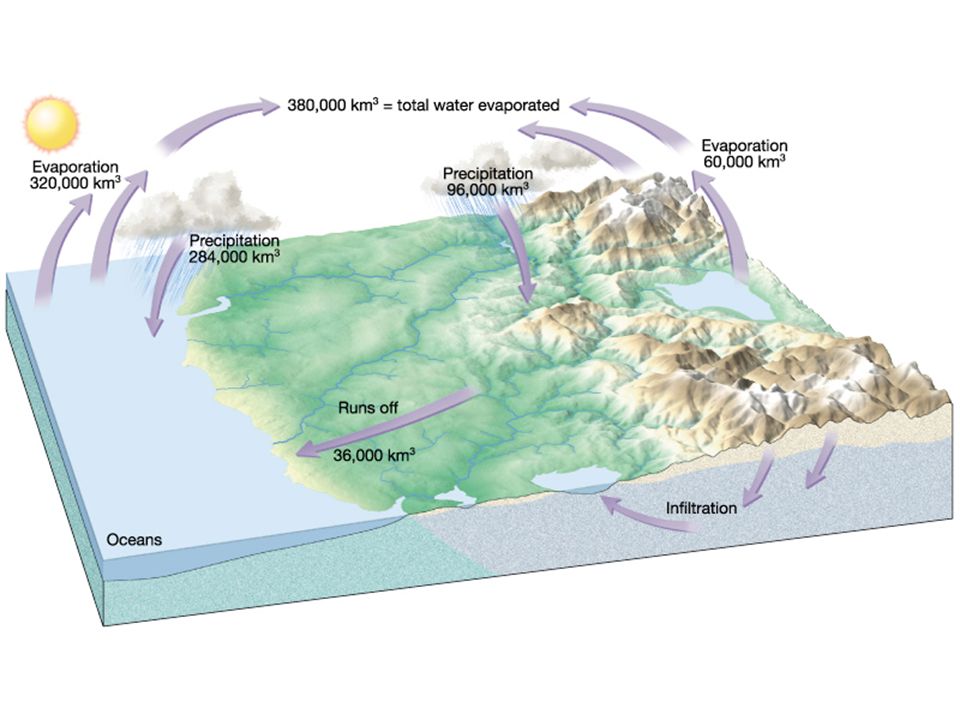
The Hydrologic Cycle Water Basics Sea water = 97.2% of world’s water Fresh Water 2.8% Polar ice and glaciers 2.15% Groundwater 0.62% Lakes and Rivers 0.01%

3
The Hydrologic Cycle The Three Fates of Precipitation Infiltration The movement of water into rocks or soil through cracks and pore spaces Runoff Water that flows over the land It is of interest to cities to reduce runoff Transpiration/Evapotranspiration the release of water vapor to the atmosphere by plants 66% in the US

5
The Hydrologic Cycle Evaluation of Precipitation Depth or magnitude of the rainfall Area over which the rain falls Duration of the rain Intensity

6
The Hydrologic Cycle Recurrence Interval The average recurrence interval between major storms or floods is easily calculated Example: there is 1 in 100 chance that a peak flow of a certain amount (say, 30,000 cf/s) can occur on a river. Thus, that river is said to have a 100-year interval

7
The Hydrologic Cycle Recurrence Interval Engineers design for particular recurrence intervals Streets 2-5 years Debris dams 5 – 25 years Upper valley dams 100 years Levees 100 yrs Large dams 1000+ years

8
The Hydrologic Cycle Factors which Have Increased Erosion Deforestation – results in increased erosion Overgrazing – also increased erosion Urbanization More rapid discharge to streams causes: More frequent floods Higher flood peaks Urban runoff is highly toxic

9
The Hydrologic Cycle Urbanization and Erosion Both natural and urban landscapes have low erosion rates Construction as natural lands is urbanized causes high erosion rates

10
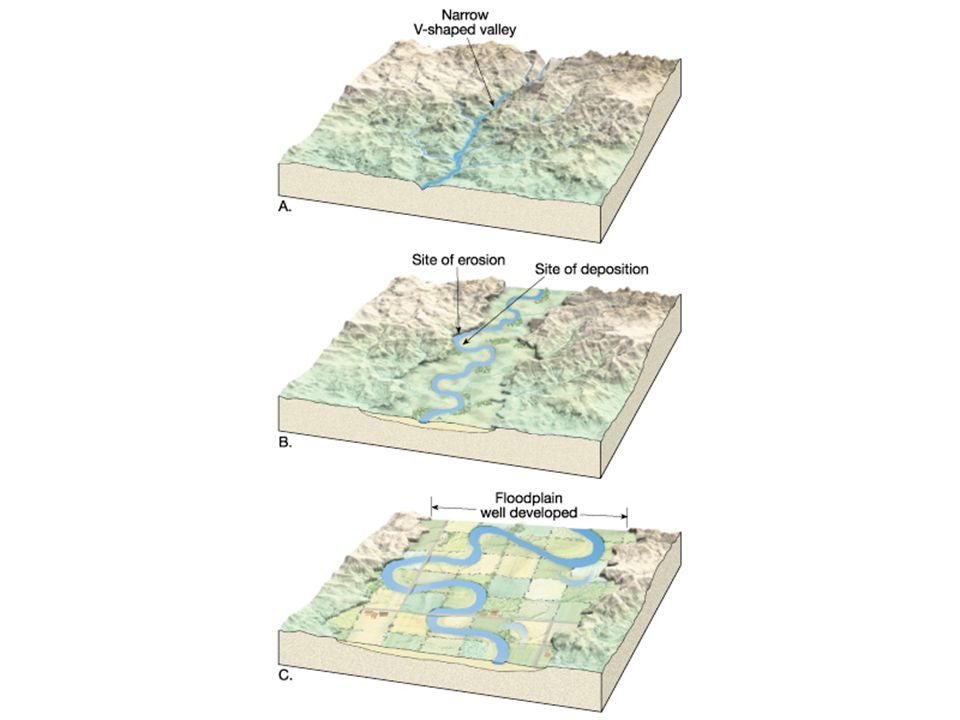
Formation of Valleys River Erosion Rivers cuts their valleys vertically and laterally Lateral erosion produces broad valleys, flood plains, and meandering streams Vertical erosion Produces deep, V-shaped valleys with rapids

12
Formation of Valleys Flood Plains Periodic floods deposit rich soils Agricultural production on floods plains is followed by urbanization Natural levees Forms as floods deposit coarse detritus near the river Naturally constraint the river except in the larger floods

13
Floods The Worst Geological Hazard They are the most costly in terms of life, property, and land They can occur almost anywhere

14
Floods The Worst Geological Hazard Damage is caused by: Erosion by flood waters Impact of water on structures Sediment deposition Contamination of surface waters

15
Floods The Worst Geological Hazard Loss of life 1887 Honan, China 900,000 killed 1911 Yangtse River 100,000 killed 1938 Southern California 60 killed 1969 Southern California 69 killed

16
Floods Causes of Floods High intensity – long duration precipitation It is greatly worsened by deforestation, farming, and urbanization Examples

17
Floods Causes of Floods Snowmelt Late spring rapid melting often results in problems down river Ice Jams Large blocks of ice clog rivers during spring breakup

18
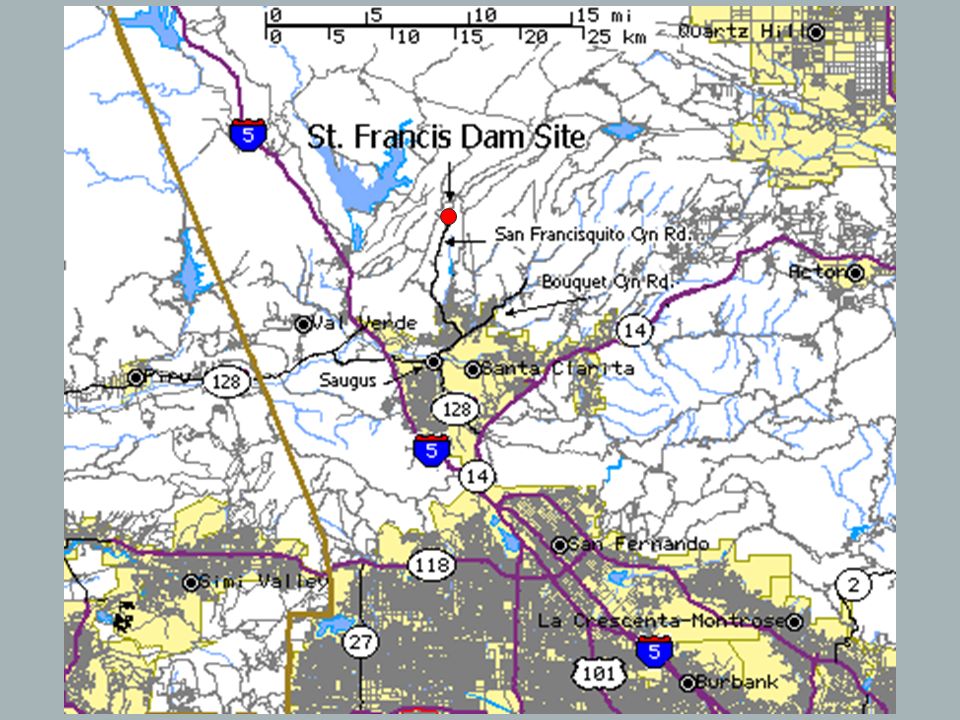
Floods Dam Failure St. Francis Dam 3/12/28 Dream of William Mulholland 200 ft high curved concrete gravity dam Failed catastrophically at midnight upon first filling 420-500 killed

20
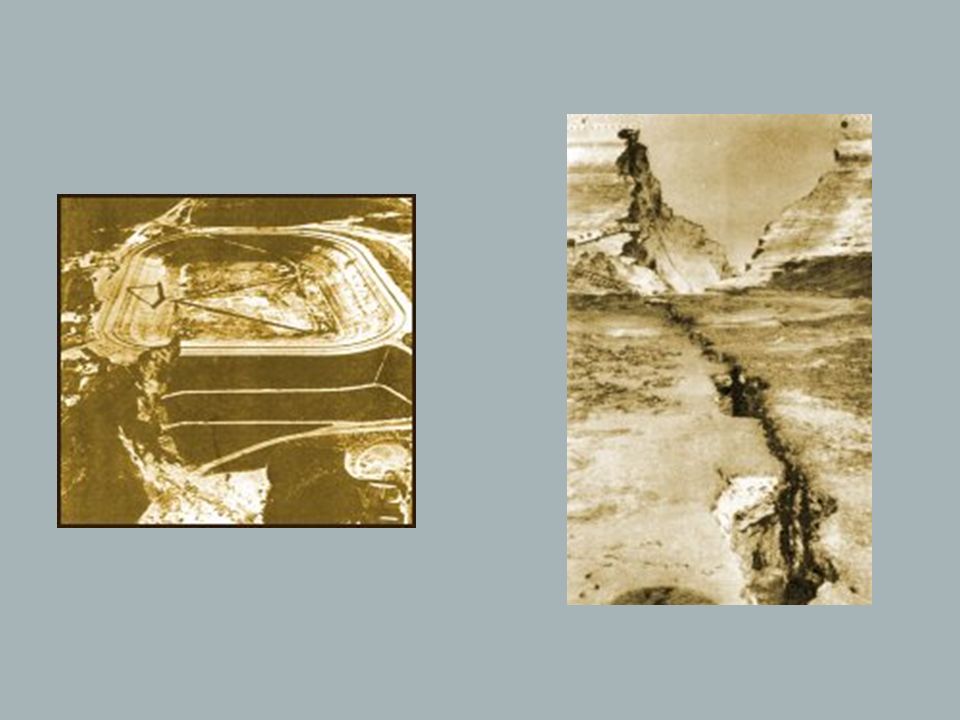
Walking across the top of the St. Francis Dam, looking west, sometime between 1926 and 1928. St. Francis Dam shortly before its March 12, 1928, collapse. It is said that this photograph was taken at noon on March 12, 1928. However, the caption on the back of the original photo reads: "Taken March 9, 1928, by E.B. (Al) Louden." In any case it is believed to be the last photograph of the St. Francis Dam before it broke at 3 1/2 minutes before midnight on March 12.
 Louden. In any case it is believed to be the last photograph of the St. Francis Dam before it broke at 3 1/2 minutes before midnight on March 12..")
21
This colorized photo shows the St. Francis Dam on its day of formal dedication in May of 1926, almost two years before the failure. http://web.umr.edu/~rogersda/st_francis_dam/

22
Photo, looking north, shows what was left of the St. Francis Dam shortly after it failed on March 12, 1928.

23
This colorized photo was taken the day after St. Francis Dam failed.

24
This picture, taken just after the 1928 disaster,looks towards the southwest. The San Francisquito Fault dips to the northwest.

25
March 11, 2001: Ruins at the base of the former St. Francis Dam in San Francisquito Canyon. The red speck in the center is a person.

27
Floods Dam Failure St. Francis Dam 3/12/28 Cause of failure complex Sespe formation prone to “slaking” excessive titling when fully loaded an absence of seepage relief in the dam's sloping abutments and the partial reactivating of underlying paleo mega-slides within the Pelona Schist.

28
Floods Dam Failure St. Francis Dam 3/12/28 Some of the most important consequences included the formulation of the world's first dam safety agency normalization of uniform engineering criteria for testing of compacted earthen materials A reassessment of all LADWP dams and reservoirs the formulation of a state-mandated process for arbitration of wrongful death suits

29
Floods Dam Failure St. Francis Dam 3/12/28 Excellent book: The St. Francis Dam Disaster Revisited,edited By Doyce B. Nunis, Jr.

30
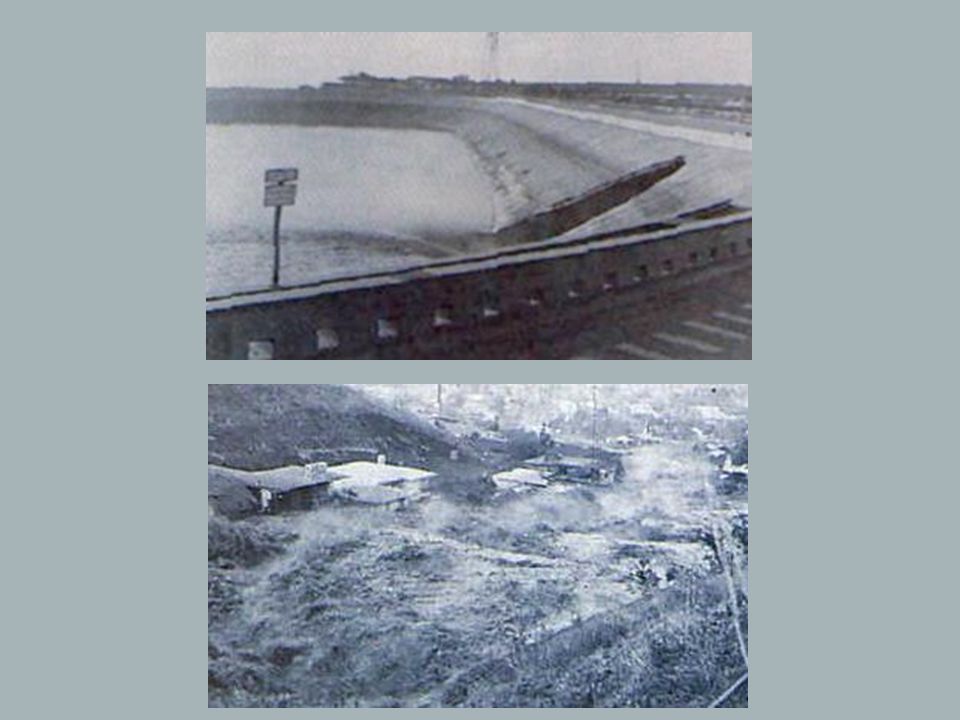
Floods Dam Failure Baldwin Hills Dam 12/14/63 Dam built on two faults Failure released 200,000,000 gallons of water 5 fatalities 200 homes damaged or destroyed

31
Floods Dam Failure Baldwin Hills Dam 12/14/63 Failure possibly due to: Movement of one of the faults resulted in the rupture Ground subsidence in the area caused by oil field operations

34
Floods Reducing Flood Damage Two Approaches Water Control Flood Plain Management, etc.

35
Floods Water Control Watershed management Erosion control Reforestation

36
Floods Dams and Reservoirs 30% of US reservoir capacity is devoted to flood control Small dams are effective in upstream areas Large dams protect the downstream areas May also produce hydroelectric power Dams have enormous negative environmental impacts

37
Location of Hydroelectric Dams

38
Southern California Dams (over 40,000 acre feet)
")
39
Floods Dams and Reservoirs Los Angeles County Drainage Area (LACDA) Projects, CA Sepulveda Dam Hansen Dam Lopez Dam Santa Fe Dam Whittier Narrows Dam Brea Dam Fullerton Dam
 Projects, CA Sepulveda Dam Hansen Dam Lopez Dam Santa Fe Dam Whittier Narrows Dam Brea Dam Fullerton Dam")
40
Floods Dams and Reservoirs Santa Ana River Drainage Basin, CA Seven Oaks Dam San Antonio Dam Prado Dam Carbon Canyon Dam

41
Floods Channel clearing and dredging Tends to deepen the channel and increase the capacity Channel alteration Cutting off meanders tends to steepen gradients and increase downcutting of the channel The Mississippi River has been shortened by 100’s of miles

42
Floods Diversions Flood waters are diverted into lakes and flood plains Channel stabilization Channel banks and floors are paved Decreases beach sand Decreases groundwater recharge

43
Floods Dikes and levees Very common world-wide to protect fertile flood plains They increase downstream flood peaks by eliminating flood plain water storage Failure often results in disaster

44
Floods Flood Plain Management Flood forecasting - Function of the River & Flood Service of the US National Weather Service Flood Plain Zoning Flood inundation maps are easy to prepare for zoning purposes Zoning is hard to do because of extensive flood plain development Urban development is the worst use of flood plains Farming, recreation, and natural areas are best

45
Federal Flood Disaster Protection Act of 1973 Provides flood insurance at affordable rates But it also Requires: Stringent control on new construction in flood plains Comprehensive flood management plans

46
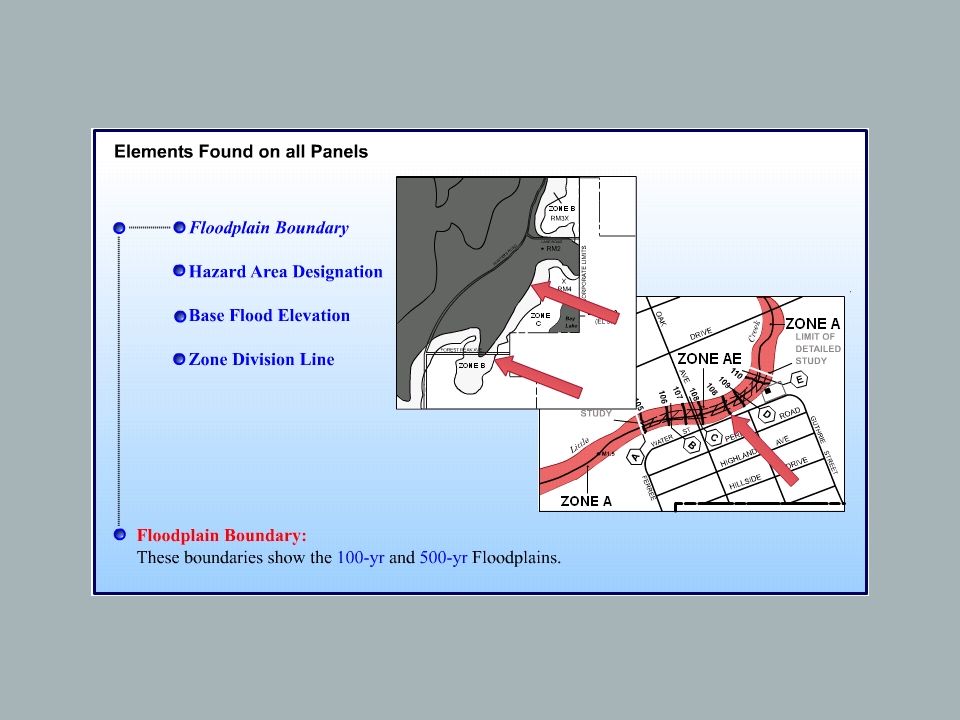
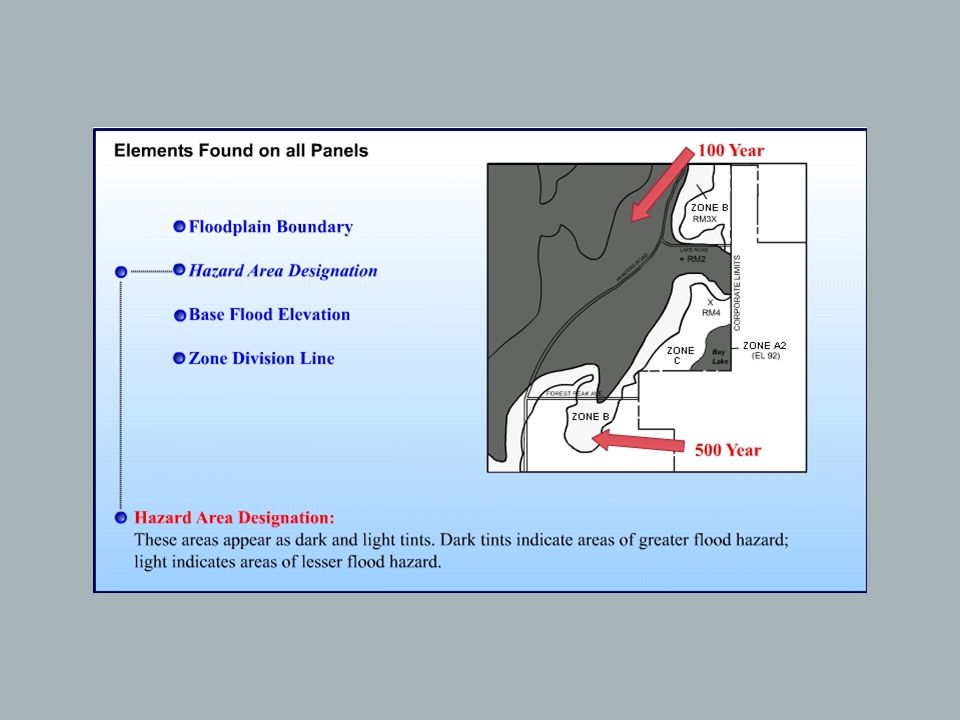
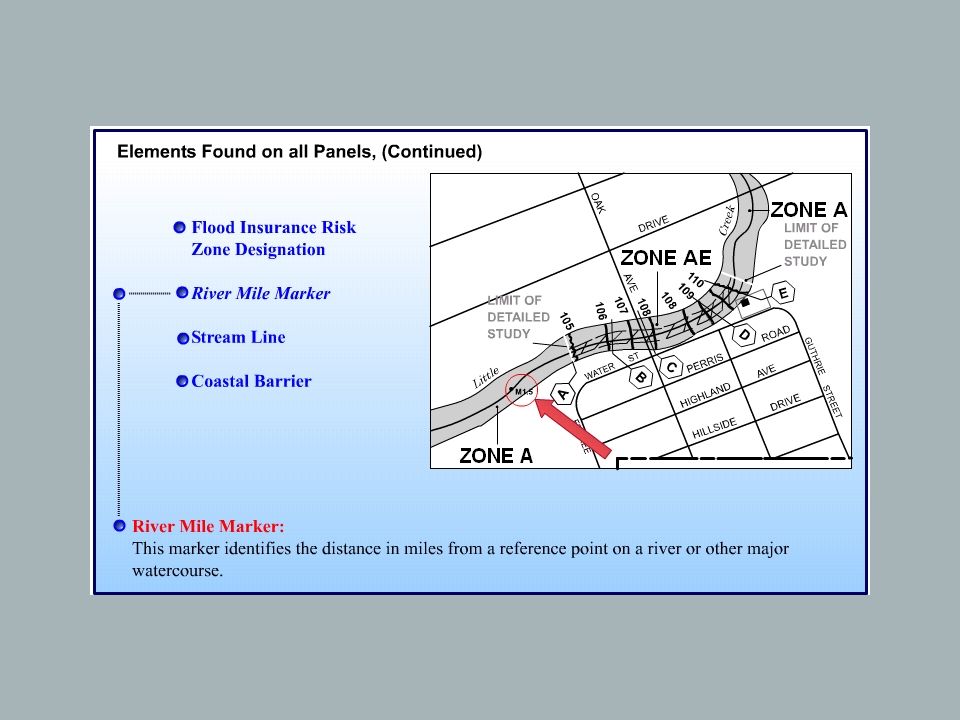
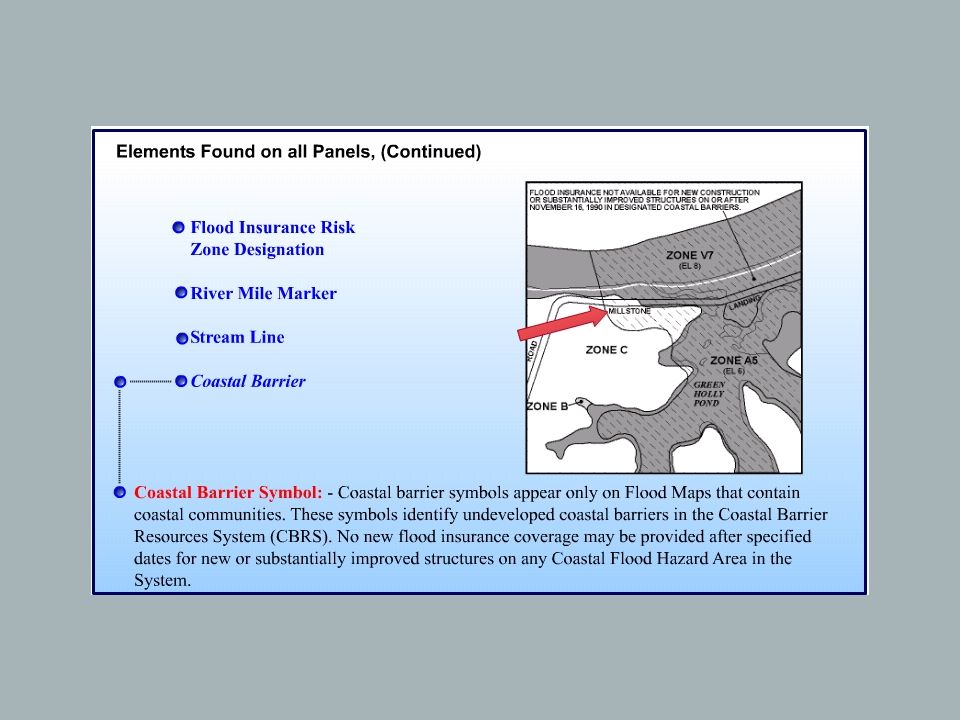
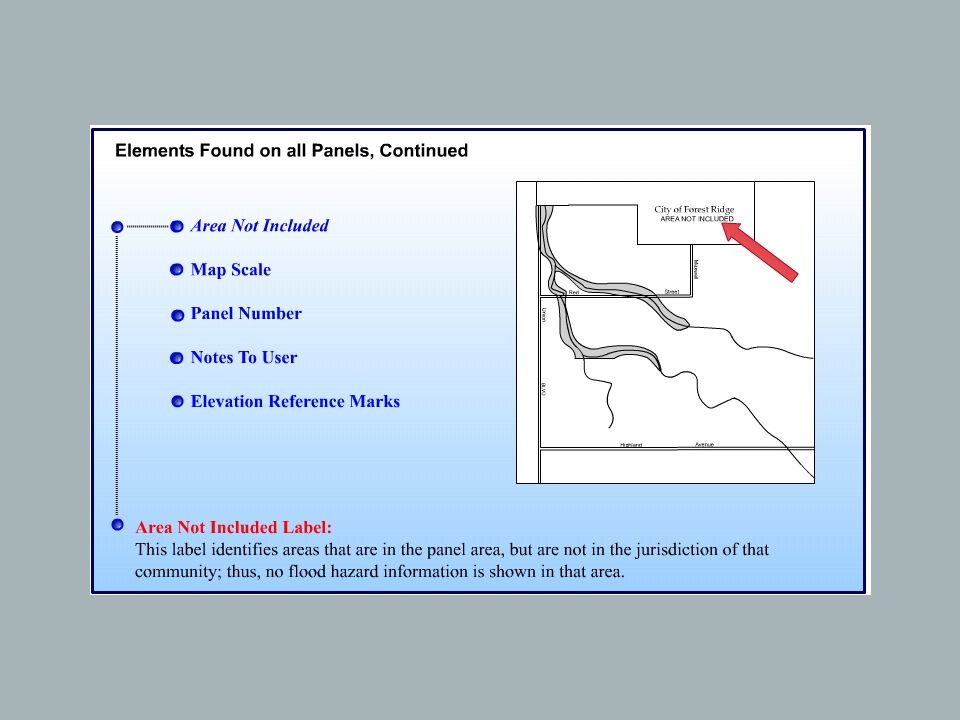
Floods FEMA Flood Insurance Rate Maps (FIRMS) Cartographers map Special Flood Hazard Areas (SFHAs) on maps SFHAs are areas that are subject to inundation by a 100-year flood
 Cartographers map Special Flood Hazard Areas (SFHAs) on maps SFHAs are areas that are subject to inundation by a 100-year flood")
Similar presentations


 Cycle. Surface Water Oceans Rivers and streams Lakes and ponds Springs – groundwater becomes surface water.>")


