Download presentation
Presentation is loading. Please wait.

1
City of Kodiak Harbor Rates

2
Harbor Rate Study Recommendations from Northern Economics – Option 1 ▫ 18.5% increase and increase based on Producer Price Index each year for the next 4 years i.e. average 2.8% increase each year Alternative Recommendation – Option 2 ▫ 6% non-compounding increase per year

3
Council Questions & Concerns Council Action:: Postponed rate increase (both options) pending more discussion, information and time for public feedback Council Questions & Concerns: Not enough time for customers to prepare for rate increase July 1, 2016 What will the cost impact be to user? Why is the moorage rate higher per foot for larger vessels ? How do we compare to other markets ?

4
User Cost Impacts: Option 1 18.5% Year One; Average 2.8% Each Year Thereafter Vessel Length ANNUAL FEE PER FOOT Current Rate FY 17FY 18FY 19FY 20FY 21 (Jan 1, 2017)(July 1, 2017)(July 1, 2018)(July 1, 2019)(July 1, 2020) 0 to 40 feet$30.0035.55 36.5537.5638.6239.7 41 to 60 feet$41.0048.58 49.9451.3452.7854.25 61 to 80 feet$61.0072.28 74.376.3978.5280.72 81 to 100 feet$71.5084.73 87.189.5492.0594.63 101 to 120 feet$82.0097.17 99.89102.69105.56108.52 121 to 150 feet$89.00105.46 108.41111.45114.57117.78 151 + feet$100.00118.5 121.81125.23128.74132.34 Vessel Length ANNUAL FEE PER VESSEL Current Rate FY 17FY 18FY 19*FY 20FY 21 40 feet$1,200.001,422.00 1,461.821,502.751,544.821,588.08 60 feet$2,460.002,914.80 2,996.413,080.313,166.563,255.23 80 feet$4,880.005,782.40 5,944.316,110.756,281.856,457.74 100 feet$7,150.008,473.00 8,710.248,954.139,204.859,462.58 120 feet$9,840.0011,660.00 11,986.4812,322.1012,667.1213,021.80 150 feet$13,350.0015,819.00 16,261.9316,717.2717,185,3517,666.39 151$15,100.0017,893.50 18,394.5218,909.5719,439.0319,983.32 Table : 1 Table : 2
(July 1, 2017)(July 1, 2018)(July 1, 2019)(July 1, 2020) 0 to 40 feet$ to 60 feet$ to 80 feet$ to 100 feet$ to 120 feet$ to 150 feet$ feet$ Vessel Length ANNUAL FEE PER VESSEL Current Rate FY 17FY 18FY 19*FY 20FY feet$1, , , , , , feet$2, , , , , , feet$4, , , , , , feet$7, , , , , , feet$9, , , , , , feet$13, , , , ,185,3517, $15, , , , , , Table : 1 Table : 2")
5
Vessel Length ANNUAL FEE PER FOOT (6% increase per year) Current Rate FY 17FY 18FY 19FY 20FY 21 (Jan 1, 2017)(July 1, 2017)(July 1, 2018)(July 1, 2019)(July 1, 2020) 0 to 40 feet$30.00$31.80$33.60$35.40$37.20$39 41 to 60 feet$41.00$43.46$45.92$48.38$50.84$53.30 61 to 80 feet$61.00$64.66$68.32$71.98$75.64$79.30 81 to 100 feet$71.50$75.79$80.08$84.37$88.66$92.95 101 to 120 feet$82.00$86.92$91.84$96.76$101.68$106.60 121 to 150 feet$89.00$94.34$99.68$105.02$110.36$115.70 151 + feet$100.00$106.00$112.00$118.00$124.00$130.00 Vessel Length ANNUAL FEE PER VESSEL (6% increase per year) Current Rate FY 17FY 18FY 19*FY 20FY 21 40 feet$1,200.00$1,272.00 $1,344.00$1,416.00$1,488.00$1,560.00 60 feet$2,460.00$2,607.60 $2,755,20$2,902.80$3,050.40$3,198.00 80 feet$4,880.00$5,172.80 $5,465.60$5,758.40$6,051.20$6,334.00 100 feet$7,150.00$7,579.00 $8,008.00$8,437.00$8,866.00$9,295.00 120 feet$9,840.00$10,430.40 $11,020.80$11,611.20$12,201.60$12,792.00 150 feet$13,350.00$14,151.00 $14,952.00$15,753.00$16,554.00$17,355.00 151$15,100.00$16,006.00 $16,912.00$17,818.00$18,724.00$19,630.00 User Cost Impacts: Option 2 (6% per year for 5 years) Table : 3 Table : 4
 Current Rate FY 17FY 18FY 19FY 20FY 21 (Jan 1, 2017)(July 1, 2017)(July 1, 2018)(July 1, 2019)(July 1, 2020) 0 to 40 feet$30.00$31.80$33.60$35.40$37.20$39 41 to 60 feet$41.00$43.46$45.92$48.38$50.84$ to 80 feet$61.00$64.66$68.32$71.98$75.64$ to 100 feet$71.50$75.79$80.08$84.37$88.66$ to 120 feet$82.00$86.92$91.84$96.76$101.68$ to 150 feet$89.00$94.34$99.68$105.02$110.36$ feet$100.00$106.00$112.00$118.00$124.00$ Vessel Length ANNUAL FEE PER VESSEL (6% increase per year) Current Rate FY 17FY 18FY 19*FY 20FY feet$1,200.00$1, $1,344.00$1,416.00$1,488.00$1, feet$2,460.00$2, $2,755,20$2,902.80$3,050.40$3, feet$4,880.00$5, $5,465.60$5,758.40$6,051.20$6, feet$7,150.00$7, $8,008.00$8,437.00$8,866.00$9, feet$9,840.00$10, $11,020.80$11,611.20$12,201.60$12, feet$13,350.00$14, $14,952.00$15,753.00$16,554.00$17, $15,100.00$16, $16,912.00$17,818.00$18,724.00$19, User Cost Impacts: Option 2 (6% per year for 5 years) Table : 3 Table : 4")
6
Vessel Length ANNUAL FEE PER VESSEL (6% increase per year) Current Rate FY 17FY 18FY 19*FY 20FY 21 40 feet$1,200.00$1,272.00 $1,344.00$1,416.00$1,488.00$1,560.00 60 feet$2,460.00$2,607.60 $2,755,20$2,902.80$3,050.40$3,198.00 80 feet$4,880.00$5,172.80 $5,465.60$5,758.40$6,051.20$6,334.00 100 feet$7,150.00$7,579.00 $8,008.00$8,437.00$8,866.00$9,295.00 120 feet$9,840.00$10,430.40 $11,020.80$11,611.20$12,201.60$12,792.00 150 feet$13,350.00$14,151.00 $14,952.00$15,753.00$16,554.00$17,355.00 151$15,100.00$16,006.00 $16,912.00$17,818.00$18,724.00$19,630.00 User Annual Cost Impacts Option 1 VS Option 2 Table : 2 Table : 4 Vessel Length ANNUAL FEE PER VESSEL (18.5% year one, 2.8% thereafter) Current Rate FY 17FY 18FY 19*FY 20FY 21 40 feet$1,200.001,422.00 1,461.821,502.751,544.821,588.08 60 feet$2,460.002,914.80 2,996.413,080.313,166.563,255.23 80 feet$4,880.005,782.40 5,944.316,110.756,281.856,457.74 100 feet$7,150.008,473.00 8,710.248,954.139,204.859,462.58 120 feet$9,840.0011,660.00 11,986.4812,322.1012,667.1213,021.80 150 feet$13,350.0015,819.00 16,261.9316,717.2717,185,3517,666.39 151$15,100.0017,893.50 18,394.5218,909.5719,439.0319,983.32
 Current Rate FY 17FY 18FY 19*FY 20FY feet$1,200.00$1, $1,344.00$1,416.00$1,488.00$1, feet$2,460.00$2, $2,755,20$2,902.80$3,050.40$3, feet$4,880.00$5, $5,465.60$5,758.40$6,051.20$6, feet$7,150.00$7, $8,008.00$8,437.00$8,866.00$9, feet$9,840.00$10, $11,020.80$11,611.20$12,201.60$12, feet$13,350.00$14, $14,952.00$15,753.00$16,554.00$17, $15,100.00$16, $16,912.00$17,818.00$18,724.00$19, User Annual Cost Impacts Option 1 VS Option 2 Table : 2 Table : 4 Vessel Length ANNUAL FEE PER VESSEL (18.5% year one, 2.8% thereafter) Current Rate FY 17FY 18FY 19*FY 20FY feet$1, , , , , , feet$2, , , , , , feet$4, , , , , , feet$7, , , , , , feet$9, , , , , , feet$13, , , , ,185,3517, $15, , , , , ,983.32")
7
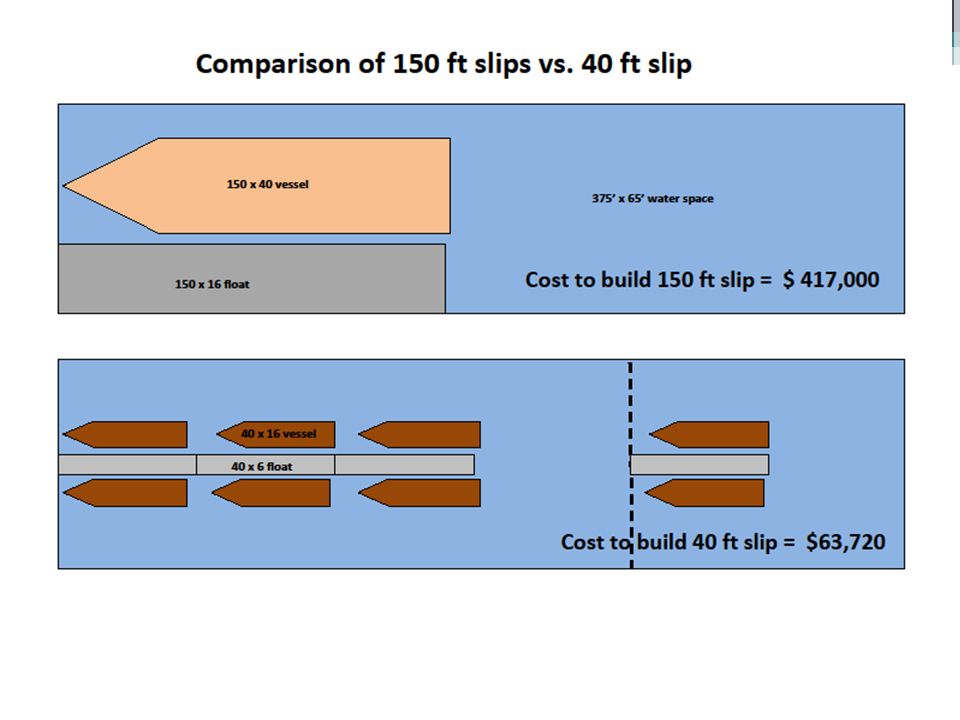
Build & Operating Cost - Per slip Table : 5 Slip Length(1) Build Cost Per LF (2) Total Build Cost Per Slip (3) Annual Build Cost Per Slip (4) Annual Operating Cost Per Slip ($60 ft) (5) Total Annual Slip Cost (6) Total Annual Revenue per slip Percent of Cost Billed 231,59336,6391,2211,3802,6011,09242% 241,59338,2321,2741,4402,7141,14042% 301,59347,7901,5931,8003,3931,42542% 401,59363,7202,1242,4004,5241,90042% 481’59376,4642,5492,8805,4292,80852% 551,59387,6152,9213,3006,2213,18852% 601,858111,4803,7163,6007,3163,51048% 621,858115,1963,8403,7207,5604,86764% 851,947165,4955,5165,10010,6167,56671% 1002,528252,8008,4276,00014,4278,90062% 1102,528278,0809,2696,60015,86910,94569% 1502,780417,00013,9009,00022,90015,97570% 1512,780419,78013,9939,06023,05217,74377% Build Cost Formula: total cost divided by total linear footage of facility (1), x length of slip = build cost per linear foot (2), divided by 30 year life cycle = slip build cost per year (3). 23 to 62 foot slips build cost based on PND estimates for replacement (2016). M, and P floats build cost based on actual cost (2008). N float build cost based on M&P actual cost (2008) plus inflation adjustment of 10%. Operational cost Formula: 50% of annual harbor enterprise fund operating cost (1,802,500), divided by total linear feet of moorage = cost per linear foot x length of slip = annual operational cost per slip (4). Annual Revenue per slip formula: Total transient revenue (525k) divided by total moorage linear feet (30k) = transient revenue per linear foot (17.50) x slip length = transient revenue per slip, + exclusive revenue per slip = total annual revenue per slip (6).
. M, and P floats build cost based on actual cost (2008). N float build cost based on M&P actual cost (2008) plus inflation adjustment of 10%. Operational cost Formula: 50% of annual harbor enterprise fund operating cost (1,802,500), divided by total linear feet of moorage = cost per linear foot x length of slip = annual operational cost per slip (4). Annual Revenue per slip formula: Total transient revenue (525k) divided by total moorage linear feet (30k) = transient revenue per linear foot (17.50) x slip length = transient revenue per slip, + exclusive revenue per slip = total annual revenue per slip (6)..")
9
St Herman Harbor N float cost 5 million in 2000 M&P floats cost 9.2 million in 2008 Estimated E thru L floats replacement cost 29 million N P M Shipyard & Travelift site

10
Market Comparisons AlaskaWashington Vessel SizeKodiakHomerSeawardDutch Harbor Fisherman’s Terminal Edmonds Marina Shilshole Bay Marina Harbor Island 40ft1,200.001,996.402,172.801,610.003,379.205,172.606,440.006,324.36 110ft9,020.005,196.405,826.7010,120.0012,156.0016,125.9621,776.28 NA

11
FY 2017 Harbor Revenues by Source

12
Harbor FY 2017 Budget - Charges for Services

13
Harbor Fund Balance Restricted for Capital Assets Restricted for Debt Service Assigned to Capital ProjectsUnassigned 2014 Actual 11,146,618 129,581Unknown 3,273,271 2015 Actual 9,877,533 129,581Unknown 3,523,982 2016 Estimated 9,877,533 129,581 2,940,901 123,096 2017 Budget 9,877,533 129,581 2,940,901 (4,187,501) 2018 Forecast 9,877,533 129,581 (4,953,392) 2019 Forecast 9,877,533 129,581 (5,821,913) 2020 Forecast 9,877,533 129,581 (6,793,063) 2021 Forecast 9,877,533 129,581 (7,866,875)
 2018 Forecast 9,877, ,581 (4,953,392) 2019 Forecast 9,877, ,581 (5,821,913) 2020 Forecast 9,877, ,581 (6,793,063) 2021 Forecast 9,877, ,581 (7,866,875)")
14
Harbor Fund – Appropriations YearAnnual Net Deficit - Appropriations FY 2016 Estimated (474,216) FY 2017 Budget(1,369,696) FY 2018 Forecasted(765,891) FY 2019 Forecasted(868,521) FY 2020 Forecasted(971,150) FY 2021 Forecasted(1,073,812)
 FY 2017 Budget(1,369,696) FY 2018 Forecasted(765,891) FY 2019 Forecasted(868,521) FY 2020 Forecasted(971,150) FY 2021 Forecasted(1,073,812)")
15
Harbor Fund Balance

16
Harbor Charges for Services – Option 1 Charges for Services FY 2017 Budget FY 2017 18.5% 1/1 FY 2018 2.8% FY 2019 2.8% FY 2020 2.8% FY 2021 2.8% Dockages AMHS 32,500 Exclusive Moorage 1,240,000 1,510,543 1,552,838 1,596,318 1,641,015 Transient Moorage 525,000 573,563 639,545 657,452 675,860 694,784 Other Misc Fees 167,000 197,895 203,436 209,132 214,988 221,008 Pier / Dock Fees 198,000 234,630 241,200 247,953 254,896 262,033 Total Charges for Services 2,162,500 2,278,588 2,627,224 2,699,875 2,774,562 2,851,340

17
Harbor Charges for Services – Option 2 Charges for Services FY 2017 Budget FY 2017 6% 1/1 FY 2018 6% FY 2019 6% FY 2020 6% FY 2021 6% Dockages AMHS 32,500 Exclusive Moorage 1,240,000 1,388,800 1,463,200 1,537,600 1,612,000 Transient Moorage 525,000 540,750 588,000 619,500 651,000 682,500 Other Misc Fees 167,000 177,020 187,040 197,060 207,080 217,100 Pier / Dock Fees 198,000 209,880 221,760 233,640 245,520 257,400 Total Charges for Services 2,162,500 2,200,150 2,418,100 2,545,900 2,673,700 2,801,500

18
Harbor Charges for Services – Comparison Charges for Services FY 2017 Budget FY 2017 6% 1/1 FY 2018 6% FY 2019 6% FY 2020 6% FY 2021 6% Option 1 2,162,500 2,278,588 2,627,223 2,699,876 2,774,562 2,851,340 Option 2 2,162,500 2,200,150 2,418,100 2,545,900 2,673,700 2,801,500 Difference -0- (78,438) (209,124) (153,975) (100,862) (49,840) * Note Option 1 generates $592,240 more revenue than Option 2 over a 5 year period
 (209,124) (153,975) (100,862) (49,840) * Note Option 1 generates $592,240 more revenue than Option 2 over a 5 year period")
19
Summary Proposed rate increase (either option) doesn’t fully address the harbors financial short falls but option 1 generates $592,240 in additional funds over the 5 year period. The tiered rate structure is justified based on build costs for the varying slip sizes, bigger slips cost more per SF to build. The smaller vessel are not charged anywhere near the build and operational cost and are far below other comparable Alaska markets. Large vessels are exceeding current Alaska markets after 5 years. What is Councils direction moving forward?

Similar presentations


 The City Manager shall each fiscal year prepare a preliminary capital improvement.>")

 The City Manager shall each fiscal year prepare a preliminary capital improvement.>")
