Download presentation
Presentation is loading. Please wait.

1
Controls on Suspended Particle Properties and Water Clarity along a Partially-Mixed Estuary, York River Estuary, Virginia Kelsey A. Fall 1, Carl T. Friedrichs 1, Grace M. Cartwright 1, and David G. Bowers 2 1 Virginia Institute of Marine Science 2 School of Ocean Sciences, Bangor University

2
Motivation: Water clarity a major water quality issue in the Chesapeake Bay. Despite decreases in sediment input water clarity has continued to deteriorate (especially in the Lower (i.e., Southern) Chesapeake Bay). 1/10 good poor good poor Percent of Secchi Depths which passed USA Environmental Protection Agency (EPA )water clarity thresholds (Williams et al., 2010)
 Chesapeake Bay). 1/10 good poor good poor Percent of Secchi Depths which passed USA Environmental Protection Agency (EPA )water clarity thresholds (Williams et al., 2010).")
3
1/10 good poor good poor Annual means of the dimensionless product of Secchi Depth times the diffuse light attenuation coefficient (Z SD K d ) for upper, middle and lower Bay (Gallegos et al.,2011). Gallegos et al. (2011) suggested that the most likely explanation for the change in the product of Z SD times K d is an increase in the concentration of continually suspended, small particles of non-algal organic matter. Percent of Secchi Depths which passed USA Environmental Protection Agency (EPA )water clarity thresholds (Williams et al., 2010) Motivation: Water clarity a major water quality issue in the Chesapeake Bay. Despite decreases in sediment input water clarity has continued to deteriorate (especially in the Lower (i.e., Southern) Chesapeake Bay).
 suggested that the most likely explanation for the change in the product of Z SD times K d is an increase in the concentration of continually suspended, small particles of non-algal organic matter. Percent of Secchi Depths which passed USA Environmental Protection Agency (EPA )water clarity thresholds (Williams et al., 2010) Motivation: Water clarity a major water quality issue in the Chesapeake Bay. Despite decreases in sediment input water clarity has continued to deteriorate (especially in the Lower (i.e., Southern) Chesapeake Bay)..")
4
Objective: Investigate the influence of suspended particle properties (size, concentration, composition) on inherent and apparent optical properties in a partially-mixed estuary. YORK RIVER CHESEAPEAKE BAY VIMS Latitude Longitude Study Site: York River Estuary, VA, U.S.A Partially mixed, microtidal estuary located adjacent to the lower Chesapeake Bay. Although the York is microtidal, tidal currents dominate suspension and peak spring surface currents can reach ~1 m/s. Depths along axis of the main channel decrease from about 20 m near the mouth to about 6 m near West Point. The channel bed is mostly mud, and Total Suspended Solids (TSS) increases up estuary to the primary ETM located near West Point. This study: Utilized observations of 7 water column profiling cruises at different stations along the York (3 in June 2013 and 4 in Sept. 2014). Average Total Suspended Solids (TSS)Average Salinity Distance from the Mouth (km) West Point 2/10 Surface Bottom TSS mgL -1 Salinity (ppt) Surface Bottom
 increases up estuary to the primary ETM located near West Point. This study: Utilized observations of 7 water column profiling cruises at different stations along the York (3 in June 2013 and 4 in Sept. 2014). Average Total Suspended Solids (TSS)Average Salinity Distance from the Mouth (km) West Point 2/10 Surface Bottom TSS mgL -1 Salinity (ppt) Surface Bottom.")
5
Coastal Hydrodynamics and Sediment Dynamics (CHSD) Water Column Profiler Deployed off vessel at various depths for along channel surveys. CHSD Profiler ADVs PICs LISST CTD (Smith and Friedrichs, 2014, 2010; Cartwright et al., 2013; 2009; Fugate and Friedrichs, 2002). Pump Sampler Pump sampler Water samples analyzed for total suspended solids (TSS) and organic content CTD with a turbidity sensor water clarity proxy Laser In-Situ Scattering and Transmissometry (LISST-100X) Suspended particle size distribution (~2.5-500 μm) Optical Transmission Particle imaging camera system (PICS) –Added 2012 particle sizes, density, and settling velocities (~30 μm- 1000 μm) Acoustic Doppler Velocimeter (ADV) provide estimates of: mass concentration of suspended particle matter Bottom: turbulence/bed stress, bulk settling velocity Radiometer (Summer 2013) or LI-COR light sensor (new 2014) Vertical profile of diffuse light attenuation (K d ) 3/10
. Pump Sampler Pump sampler Water samples analyzed for total suspended solids (TSS) and organic content CTD with a turbidity sensor water clarity proxy Laser In-Situ Scattering and Transmissometry (LISST-100X) Suspended particle size distribution (~ μm) Optical Transmission Particle imaging camera system (PICS) –Added 2012 particle sizes, density, and settling velocities (~30 μm μm) Acoustic Doppler Velocimeter (ADV) provide estimates of: mass concentration of suspended particle matter Bottom: turbulence/bed stress, bulk settling velocity Radiometer (Summer 2013) or LI-COR light sensor (new 2014) Vertical profile of diffuse light attenuation (K d ) 3/10.")
6
Particle area concentration (per Liter) for size class (i): Characterization of Particle Area with the LISST (2.5-500 μm) and PICS (30-1000μm) Particle surface area important property to consider, because it is the area that is effective in blocking light. Used LISST and PICs to determine particle area concentration per size class (i) [A i ]: Example from surface water September 2014: LISST PICS 4/10 (Neukermans et al., 2014; Smith and Friedrichs, 2010) Note: Area peaks at ~3 at lowest size class. Figure adjusted to see larger grain sizes better. A i cm 2 /L Particle Size μm Area Concentration Distributions [A i ]
 [A i ]: Example from surface water September 2014: LISST PICS 4/10 (Neukermans et al., 2014; Smith and Friedrichs, 2010) Note: Area peaks at ~3 at lowest size class. Figure adjusted to see larger grain sizes better. A i cm 2 /L Particle Size μm Area Concentration Distributions [A i ].")
7
Characterization of Particle Area with the LISST (2.5-500 μm) and PICS (30-1000μm) Combine PICS and LISST to create new volume and area distributions from 2.5-1000 μm where: 2.5-60 μm: LISST 60-200 μm: Linearly weighted average of LISST and PICS 200-1000 μm: PICS 4/10 (Neukermans et al., 2014; Smith and Friedrichs, 2010) LISSTAVGPICS LISST PICS Example from September 2014: Note: Area peaks at ~3 at lowest size class. Figure adjusted to see larger grain sizes better. A i cm 2 /L Area Concentration Distributions [A i ] Particle Size μm

8
Characterization of Particle Area with the LISST (2.5-500 μm) and PICS (30-1000μm) Combine PICS and LISST to create new volume and area distributions from 2.5-1000 μm where: 2.5-60 μm: LISST 60-200 μm: Linearly weighted average of LISST and PICS 200-1000 μm: PICS 4/10 (Neukermans et al., 2014; Smith and Friedrichs, 2010) LISSTAVGPICS LISST range dominates particle area. A i cm 2 /L Area Concentration Distributions [A i ] Particle Size μm Example from surface water September 2014:

9
Characterization of Particle Area with the LISST (2.5-500 μm) and PICS (30-1000μm) Combine PICS and LISST to create new volume and area distributions from 2.5-1000 μm where: 2.5-60 μm: LISST 60-200 μm: Linearly weighted average of LISST and PICS 200-1000 μm: PICS 4/10 (Neukermans et al., 2014; Smith and Friedrichs, 2010) LISSTAVGPICS LISST range dominates particle area. But PICS range contributes to volume concentration V μL/L Volume Concentration Distribution [V i ] Small organics(?) Microflocs Macroflocs Particle Size μm A i cm 2 /L Area Concentration Distributions [A i ] Particle Size μm Example from surface water September 2014: Volume ≈ Area x Size
 Microflocs Macroflocs Particle Size μm A i cm 2 /L Area Concentration Distributions [A i ] Particle Size μm Example from surface water September 2014: Volume ≈ Area x Size.")
10
Characterization of Particle Area with the LISST (2.5-500 μm) and PICS (30-1000μm) Define particle size characteristics with new distributions ( D 50A, A T, D 50V ): D 50A : Median particle size based on area distribution. A T : Total area per liter (A T =Σa i ) D 50V : Median particle size based on volume distribution. 4/10 (Neukermans et al., 2014; Smith and Friedrichs, 2010) D 50A =6.2 microns A T =11.38 cm 2 /L D 50v =24.4 microns V μL/L Volume Concentration Distribution [V i ] Particle Size μm A i cm 2 /L Area Concentration Distributions [A i ] Particle Size μm Example from surface water September 2014: Volume ≈ Area x Size
 D 50V : Median particle size based on volume distribution. 4/10 (Neukermans et al., 2014; Smith and Friedrichs, 2010) D 50A =6.2 microns A T =11.38 cm 2 /L D 50v =24.4 microns V μL/L Volume Concentration Distribution [V i ] Particle Size μm A i cm 2 /L Area Concentration Distributions [A i ] Particle Size μm Example from surface water September 2014: Volume ≈ Area x Size.")
11
Inherent and Apparent Optical Properties of Surface Water LISST Beam Attenuation Coefficient C m -1 Distance from the Mouth (km) Sept. 2014 June 2013 1. Beam Attenuation Coefficient (C) Inherent: Depends only on medium, not ambient light field Measured by LISST beam transmission (T): where z is beam path length. LISST z=0.05 m. Measures C at 670 nm (+/- 0.1 nm) 5/10 (Boss, 2003; Kirk, 1994; Lund-Hansen et al., 2010; LISST-100 User’s Guide; Neukermans et al., 2014)
 Inherent: Depends only on medium, not ambient light field Measured by LISST beam transmission (T): where z is beam path length. LISST z=0.05 m. Measures C at 670 nm (+/- 0.1 nm) 5/10 (Boss, 2003; Kirk, 1994; Lund-Hansen et al., 2010; LISST-100 User’s Guide; Neukermans et al., 2014).")
12
K d m -1 Vertical Diffuse Light Attenuation Coefficient Distance from the Mouth (km) Sept. 2014 June 2013 Sept. 2014 June 2013 5/10 1. Beam Attenuation Coefficient (C) Inherent: Depends only on medium, not ambient light field Measured by LISST beam transmission (T): where z is beam path length. LISST z=0.05 m. Measures C at 670 nm (+/- 0.1 nm) 2. Vertical Diffuse Light Attenuation Coefficient (K d ) Apparent: Depends on medium and ambient light field Measured by either Radiometer or LICOR downward irradiance (E d ) at two depths (z 1,z 2 ): Measures PAR (400-700 nm) (Boss, 2003; Kirk, 1994; Lund-Hansen et al., 2010; LISST-100 User’s Guide; Neukermans et al., 2014) Inherent and Apparent Optical Properties of Surface Water LISST Beam Attenuation Coefficient C m -1 Distance from the Mouth (km)
 Inherent: Depends only on medium, not ambient light field Measured by LISST beam transmission (T): where z is beam path length. LISST z=0.05 m. Measures C at 670 nm (+/- 0.1 nm) 2. Vertical Diffuse Light Attenuation Coefficient (K d ) Apparent: Depends on medium and ambient light field Measured by either Radiometer or LICOR downward irradiance (E d ) at two depths (z 1,z 2 ): Measures PAR ( nm) (Boss, 2003; Kirk, 1994; Lund-Hansen et al., 2010; LISST-100 User’s Guide; Neukermans et al., 2014) Inherent and Apparent Optical Properties of Surface Water LISST Beam Attenuation Coefficient C m -1 Distance from the Mouth (km).")
13
Similar Temporal and Spatial Variability: Sept. 2014 June 2013 5/10 (Boss, 2003; Kirk, 1994; Lund-Hansen et al., 2010; LISST-100 User’s Guide; Neukermans et al., 2014) Sept. 2014 June 2013 1. Beam Attenuation Coefficient (C) Inherent: Depends only on medium, not ambient light field Measured by LISST beam transmission (T): where z is beam path length. LISST z=0.05 m. Measures C at 670 nm (+/- 0.1 nm) 2. Vertical Diffuse Light Attenuation Coefficient (K d ) Apparent: Depends on medium and ambient light field Measured by either Radiometer or LICOR downward irradiance (E d ) at two depths (z 1,z 2 ): Measures PAR (400-700 nm) Inherent and Apparent Optical Properties of Surface Water K d m -1 Distance from the Mouth (km) C m -1 Distance from the Mouth (km) Vertical Diffuse Light Attenuation Coefficient LISST Beam Attenuation Coefficient
 Sept June Beam Attenuation Coefficient (C) Inherent: Depends only on medium, not ambient light field Measured by LISST beam transmission (T): where z is beam path length. LISST z=0.05 m. Measures C at 670 nm (+/- 0.1 nm) 2. Vertical Diffuse Light Attenuation Coefficient (K d ) Apparent: Depends on medium and ambient light field Measured by either Radiometer or LICOR downward irradiance (E d ) at two depths (z 1,z 2 ): Measures PAR ( nm) Inherent and Apparent Optical Properties of Surface Water K d m -1 Distance from the Mouth (km) C m -1 Distance from the Mouth (km) Vertical Diffuse Light Attenuation Coefficient LISST Beam Attenuation Coefficient.")
14
r 2 =0.88 K d m -1 C m -1 Strong linear regression between C and K d : Beam Attenuation versus Light Attenuation 5/10 (Boss, 2003; Kirk, 1994; Lund-Hansen et al., 2010; LISST-100 User’s Guide; Neukermans et al., 2014) Inherent and Apparent Optical Properties of Surface Water 1. Beam Attenuation Coefficient (C) Inherent: Depends only on medium, not ambient light field Measured by LISST beam transmission (T): where z is beam path length. LISST z=0.05 m. Measures C at 670 nm (+/- 0.1 nm) 2. Vertical Diffuse Light Attenuation Coefficient (K d ) Apparent: Depends on medium and ambient light field Measured by either Radiometer or LICOR downward irradiance (E d ) at two depths (z 1,z 2 ): Measures PAR (400-700 nm)
 Inherent: Depends only on medium, not ambient light field Measured by LISST beam transmission (T): where z is beam path length. LISST z=0.05 m. Measures C at 670 nm (+/- 0.1 nm) 2. Vertical Diffuse Light Attenuation Coefficient (K d ) Apparent: Depends on medium and ambient light field Measured by either Radiometer or LICOR downward irradiance (E d ) at two depths (z 1,z 2 ): Measures PAR ( nm).")
15
Preliminary Look at Controls on Optical Attenuation (C and K d ): Total Suspended Solids (TSS) K d m -1 K d versus TSS C m -1 C versus TSS TSS (mgL -1 ) 6/10 (Lund-Hansen et al., 2010)
: Total Suspended Solids (TSS) K d m -1 K d versus TSS C m -1 C versus TSS TSS (mgL -1 ) 6/10 (Lund-Hansen et al., 2010)")
16
K d m -1 K d versus TSS C m -1 C versus TSS TSS (mgL -1 ) Preliminary Look at Controls on Optical Attenuation (C and K d ): Total Suspended Solids (TSS) K dDISS C DISS K dDISS ~0.22 m -1 C DISS ~2.8 m -1 Use intercept from linear fit for TSS < 40 mg/L to estimate attenuation due to water and dissolved constituents (K dDISS and C DISS ). 6/10 (Lund-Hansen et al., 2010)
.")
17
K d m -1 K d versus TSS C m -1 C versus TSS TSS (mgL -1 ) Preliminary Look at Controls on Optical Attenuation (C and K d ): Total Suspended Solids (TSS) K dDISS C DISS K dDISS ~0.22 m -1 C DISS ~2.8 m -1 6/10 (Lund-Hansen et al., 2010) Calculate light (K dP ) and beam (C p ) attenuation due to particles: 1. K dP = K d - K dDISS 2. C p = C - C DISS

18
Preliminary Look at Controls on Optical Attenuation (C and K d ): Total Suspended Solids (TSS) K dP m -1 TSS mgL -1 K dP versus TSS Remove K dDISS ~0.22 m -1 Remove C DISS ~2.8 m -1 C P m -1 C P versus TSS TSS mgL -1 6/10 (Lund-Hansen et al., 2010) K d m -1 K d versus TSS C m -1 C versus TSS K dDISS C DISS K dDISS ~0.22 m -1 C DISS ~2.8 m -1
: Total Suspended Solids (TSS) K dP m -1 TSS mgL -1 K dP versus TSS Remove K dDISS ~0.22 m -1 Remove C DISS ~2.8 m -1 C P m -1 C P versus TSS TSS mgL -1 6/10 (Lund-Hansen et al., 2010) K d m -1 K d versus TSS C m -1 C versus TSS K dDISS C DISS K dDISS ~0.22 m -1 C DISS ~2.8 m -1")
19
Preliminary Look at Controls on Optical Properties (C P and K dP ): Area vs TSS r 2 =0.87 r 2 =0.67 r 2 =0.97 r 2 =0.78 K dP versus A T C P versus A T K dP versus TSS C P versus TSS A T cm 2/ L TSS mgL -1 K dP m -1 C P m -1 K dP m -1 C P m -1 A T cm 2/ L 7/10
: Area vs TSS r 2 =0.87 r 2 =0.67 r 2 =0.97 r 2 =0.78 K dP versus A T C P versus A T K dP versus TSS C P versus TSS A T cm 2/ L TSS mgL -1 K dP m -1 C P m -1 K dP m -1 C P m -1 A T cm 2/ L 7/10")
20
Preliminary Look at Controls on Optical Properties (C P and K dP ): Area vs TSS r 2 =0.87 r 2 =0.67 r 2 =0.97 r 2 =0.78 K dP versus A T C P versus A T K dP versus TSS C P versus TSS A T cm 2/ L TSS mgL -1 K dP m -1 C P m -1 K dP m -1 C P m -1 A T cm 2/ L Attenuation explained better by A T than TSS. (Also C p less noisy than K dp ) 7/10
 7/10.")
21
Preliminary Look at Controls on Optical Properties (C P and K dP ): Relationship to Area Attenuation explained better by A T than TSS. Others (e.g., Neukermans et al., 2014) suggest that attenuation due to particles (both diffuse light and beam) become nearly constant when normalized by A T : ≈ constant, ≈ constant r 2 =0.87 r 2 =0.97 K dP versus A T C P versus A T A T cm 2/ L K dP m -1 C P m -1 A T cm 2/ L 8/10
 suggest that attenuation due to particles (both diffuse light and beam) become nearly constant when normalized by A T : ≈ constant, ≈ constant r 2 =0.87 r 2 =0.97 K dP versus A T C P versus A T A T cm 2/ L K dP m -1 C P m -1 A T cm 2/ L 8/10.")
22
Preliminary Look at Controls on Optical Properties (C P and K dP ): Relationship to Area Attenuation explained better by A T than TSS. Others (e.g., Neukermans et al., 2014) suggest that attenuation due to particles (both diffuse light and beam) become nearly constant when normalized by A T : ≈ constant, ≈ constant r 2 =0.87 r 2 =0.97 K dP versus A T C P versus A T A T cm 2/ L K dP m -1 C P m -1 A T cm 2/ L 8/10 Does this hold for York estuary? What are causes of any observed variations? (note that above plots are log-log, not linear) Next step: Normalize K dp and C p by A T to see if it is independent of particle composition.
 suggest that attenuation due to particles (both diffuse light and beam) become nearly constant when normalized by A T : ≈ constant, ≈ constant r 2 =0.87 r 2 =0.97 K dP versus A T C P versus A T A T cm 2/ L K dP m -1 C P m -1 A T cm 2/ L 8/10 Does this hold for York estuary. What are causes of any observed variations. (note that above plots are log-log, not linear) Next step: Normalize K dp and C p by A T to see if it is independent of particle composition..")
23
Preliminary Look at Controls on Optical Properties (C P and K dP ): Relationship to Area Others (e.g., Neukermans et al., 2014) suggest that attenuation due to particles (both light and beam) become nearly constant when normalized by A T : ≈ constant, ≈ constant 8/10 Does this hold for York estuary? What are causes of any observed variations? (now the above plots are linear) K dP normalized by A T versus organic matter content C P normalized by A T versus organic matter content K dP /A T C P /A T Fraction Organic Content No, our measurements (erroneously?) do not show area-normalized attenuation to be constant.
 K dP normalized by A T versus organic matter content C P normalized by A T versus organic matter content K dP /A T C P /A T Fraction Organic Content No, our measurements (erroneously ) do not show area-normalized attenuation to be constant..")
24
Preliminary Look at Controls on Optical Properties (C P and K dP ): Relationship to Area Others (e.g., Neukermans et al., 2014) suggest that attenuation due to particles (both light and beam) become nearly constant when normalized by A T : ≈ constant, ≈ constant 8/10 K dP normalized by A T versus organic matter content C P normalized by A T versus organic matter content K dP /A T C P /A T Fraction Organic Content We need to consider instrument limitations, smallest particle measured by the LISST is 2.5 μm, while filters used to measure organic content capture grains down to 0.7 μm. Our LISST is NOT able to adequately include the smallest particles which could contribute a significant portion of A T.

25
Simple Solution: Use iterative approach to estimate the particle area not captured by the LISST (A Tsp for sizes 0.7-2.5 microns) needed to make both K dp /(A T +A Tsp ) and C p /(A T +A Tsp ) nearly constant. Iterations suggest A Tsp ≈ 20 cm 2 /L Δ With A tsp ☐ Without A Tsp K dP /A T and K dP /A T +A Tsp C P /A T and C P /A T +A Tsp Preliminary Look at Controls on Optical Properties(C P and K dP ): Relationship to Area The addition of the A tsp shows area-normalized attenuation to be nearly constant. Fraction Organic Content K dP normalized by A T versus organic matter content C P normalized by A T versus organic matter content 8/10
: Relationship to Area The addition of the A tsp shows area-normalized attenuation to be nearly constant. Fraction Organic Content K dP normalized by A T versus organic matter content C P normalized by A T versus organic matter content 8/10.")
26
Simple Solution: Use iterative approach to estimate the particle area not captured by the LISST (A Tsp for sizes 0.7-2.5 microns) needed to make both K dp /(A T +A Tsp ) and C p /(A T +A Tsp ) nearly constant. Iterations suggest A Tsp ≈ 20 cm 2 /L Δ With A tsp ☐ Without A Tsp K dP /A T and K dP /A T +A Tsp C P /A T and C P /A T +A Tsp Preliminary Look at Controls on Optical Properties(C P and K dP ): Relationship to Area The addition of the A tsp shows area-normalized attenuation to be nearly constant. Now adjust D 50A calculation to account for additional A Tsp. by evenly distributing A Tsp among new additional sizes classes (0.7-2.5 microns). Fraction Organic Content K dP normalized by A T versus organic matter content C P normalized by A T versus organic matter content 8/10
: Relationship to Area The addition of the A tsp shows area-normalized attenuation to be nearly constant. Now adjust D 50A calculation to account for additional A Tsp. by evenly distributing A Tsp among new additional sizes classes ( microns). Fraction Organic Content K dP normalized by A T versus organic matter content C P normalized by A T versus organic matter content 8/10.")
27
Preliminary Look at the Relationship Between Particle Size and Composition (Organic Content): 102025 Fraction Organic Content D 50A in Log Space r 2 =0.0023 p=0.80 r 2 =0.16 p=0.01 r 2 =0.23 p=0.005 D 50A has a stronger, more significant negative correlation to organic matter content (i.e. smaller particles are more organic). D 50V does not show this trend. 9/10 Δ Adjusted D 50A Unadjusted D 50A ☐ D 50V Δ Adjusted D 50A Unadjusted D 50A D 50 in Log Space
. D 50V does not show this trend. 9/10 Δ Adjusted D 50A Unadjusted D 50A ☐ D 50V Δ Adjusted D 50A Unadjusted D 50A D 50 in Log Space.")
28
Preliminary Look at the Relationship Between Particle Size and Composition (Organic Content): 102025 Fraction Organic Content D 50 in Log Space r 2 =0.0023 p=0.80 r 2 =0.16 p=0.01 r 2 =0.23 p=0.005 9/10 Δ Adjusted D 50A Unadjusted D 50A ☐ D 50V The most relevant D 50 for attenuation light (i.e. medium size by area) is much smaller than the “classic” D 50 by volume. D 50A for surface waters is 10 to 20 times smaller than D 50v. Δ Adjusted D 50A Unadjusted D 50A D 50 in Log Space
 is much smaller than the classic D 50 by volume. D 50A for surface waters is 10 to 20 times smaller than D 50v. Δ Adjusted D 50A Unadjusted D 50A D 50 in Log Space.")
29
Conclusions: Strong linear regression between Beam Attenuation Coefficient (C) and Vertical Diffuse Attenuation Coefficient (K d ), which allows (C) to be a proxy of K d (surface water clarity for photosynthesis) when K d values are not available. After removing effects of water and dissolved materials, both Particle Beam Attenuation Coefficient (C p ) and Particles Diffuse Attenuation Coefficient (K dP ) are better explained by total particle area concentration (A T ) than total suspended solids (TSS). There is a contribution of area of smaller particles that cannot be detected by the current LISST (A Tsp ~0.7 - 2.5 microns ) that needs to be accounted for when looking at total total particle area concentration (A T + A Tsp ) as well as D 50A. Preliminary results from the York indicate importance of these small, more organic particles on optical properties. The medium particle size for attenuating light in surface waters is 10 to 20 times smaller than the classic D 50 by volume. Future work will include (i) many more sampling cruises and (hopefully) (ii) deployment of a LISST that can detect smaller particle sizes. 10/10
 and Particles Diffuse Attenuation Coefficient (K dP ) are better explained by total particle area concentration (A T ) than total suspended solids (TSS). There is a contribution of area of smaller particles that cannot be detected by the current LISST (A Tsp ~ microns ) that needs to be accounted for when looking at total total particle area concentration (A T + A Tsp ) as well as D 50A. Preliminary results from the York indicate importance of these small, more organic particles on optical properties. The medium particle size for attenuating light in surface waters is 10 to 20 times smaller than the classic D 50 by volume. Future work will include (i) many more sampling cruises and (hopefully) (ii) deployment of a LISST that can detect smaller particle sizes. 10/10.")
30
Acknowledgements Marjy Friedrichs Tim Gass Wayne Reisner Ken Moore Jarrell Smith Steve SynderFunding: Erin Shields Questions? 11/11

31
Cp/TSS D50 in Log-space Δ New Area Area ☐ Volume D50 in Log-space Fraction Organic Content Δ New Area Area

32
Δ New Area Area Fraction Organic Content D50_A microns Cp/TSS

33
☐ Volume D50_V microns Fraction Organic Content Cp/TSS D50_V microns

34
Preliminary Look at Controls on Optical Properties (C P and K dP ): Composition and Size K dP /TSS Fraction Organic Matter D 50A μm C P /TSS Fraction Organic Matter A. K dP per unit mass versus fraction organic matter C. K dP per unit mass versus D 50A D. C P per unit mass versus D 50A B. C P per unit mass versus fraction organic matter K dp and C p per unit mass OM and D 50A 9/10

35
Preliminary Look at Controls on Optical Properties (C P and K dP ): Composition and Size K dP /TSS Fraction Organic Matter D 50A μm C P /TSS Fraction Organic Matter A. K dP per unit mass versus fraction organic matter C. K dP per unit mass versus D 50A D. C P per unit mass versus D 50A B. C P per unit mass versus fraction organic matter Smaller/more organic particles attenuate more light per unit mass than larger particles. 9/10

36
Preliminary Look at Controls on Optical Properties (C P and K dP ): Relationship to Area Attenuation explained better by A T than TSS. Others (e.g., Neukermans et al., 2014) suggest that attenuation due to particles (both light and beam) become constant when normalized by A T : = constant, = constant r 2 =0.87 r 2 =0.97 C. K dP versus A T D. C P versus A T A T cm 2/ L K dP m -1 C P m -1 A T cm 2/ L 8/10
 suggest that attenuation due to particles (both light and beam) become constant when normalized by A T : = constant, = constant r 2 =0.87 r 2 =0.97 C. K dP versus A T D. C P versus A T A T cm 2/ L K dP m -1 C P m -1 A T cm 2/ L 8/10.")
37
Preliminary Look at Controls on Optical Properties (C P and K dP ): Relationship to Area Attenuation explained better by A T than TSS. Our results (and others, i.e. Neukermans et al., 2014) suggest that attenuation due to particles (both light and beam) become constant when normalized by A T : Does this hold true? What are causes of any observed variations? r 2 =0.87 r 2 =0.97 C. K dP versus A T D. C P versus A T A T cm 2/ L K dP m -1 C P m -1 A T cm 2/ L = constant, = constant 8/10
 suggest that attenuation due to particles (both light and beam) become constant when normalized by A T : Does this hold true. What are causes of any observed variations. r 2 =0.87 r 2 =0.97 C. K dP versus A T D. C P versus A T A T cm 2/ L K dP m -1 C P m -1 A T cm 2/ L = constant, = constant 8/10.")
38
We expect K d /A (light attenuation normalized by area) to be constant. Why isn’t it? Are we underestimating area? Recall LISST range: 2.5-500 mircons, and PICS 30-1000 microns. Big sizes-not too worried about- we are in the top of the water column during slack, however are we missing smaller, organic particles. Investigate deviations ? Why not constant.

39
10-15-14- Use iterations to estimate the area that would not be captured by the LISST (A sp ~0.7=2.5 microns ). Found A of about ~20 cm^2/L was missing. LICOR K D per AREA vs D50ALISST Attenuation per AREA versus D50A Adjusting with estimated A SP shows the expected relationship for both, ie. K DP /A=Constant and 1-L trans /A=Constant. LISST attenuation is less noisy than K d.

40
10-15-14 LICOR K D per MASS vs D 50 areaLISST Transmission per MASS vs D 50 Area K d and LISST optical attenuation per unit mass both increase with more smaller particles. Relationship between LISST trans less noisy. Smaller particles attenuate more light per unit mass than larger particles.

41
10-15-14 LICOR K D per MASS vs Organic Matter LISST Transmission per MASS versus Organic Matter Not a strong relationship between K d and LISST optical attenuation per unit mass and organic matter. Relationship between LISST trans less noisy. Neglecting particle size, increase in organic matter increase attenuation.

42
Preliminary look at trends along the York River : June 2013 vs. September 2014 Kd m -1 1-L Transmission A. Light Attenuation measured by LICOR meterB. LISST Attenuation determined by LISST transmission Light Attenuation: (Apparent and Inherent) Distance from the Mouth (km) LISST Transmission good proxy for K d.
 Distance from the Mouth (km) LISST Transmission good proxy for K d..")
43
Preliminary look at trends along the York River : June 2013 vs. September 2014 W s mms -1 Percent Organic TSS mgL -1 Distance from the Mouth (km) C. Total Suspended SolidsD. Percent Organic Matter E. PICS mean W s of particles from 30-1000 μm D 50 μm F. PICS D 50 by mass of particles from 30-1000 μm Kd m -1 1-L Transmission A. Light Attenuation measured by LICOR meterB. LISST Attenuation determined by LISST transmission Light Attenuation: (Apparent and Inherent) Suspended Particle Properties:
 C. Total Suspended SolidsD. Percent Organic Matter E. PICS mean W s of particles from μm D 50 μm F. PICS D 50 by mass of particles from μm Kd m -1 1-L Transmission A. Light Attenuation measured by LICOR meterB. LISST Attenuation determined by LISST transmission Light Attenuation: (Apparent and Inherent) Suspended Particle Properties:.")
44
r 2 =0.87r 2 =0.67 K d explained more by particle A than TSS.

45
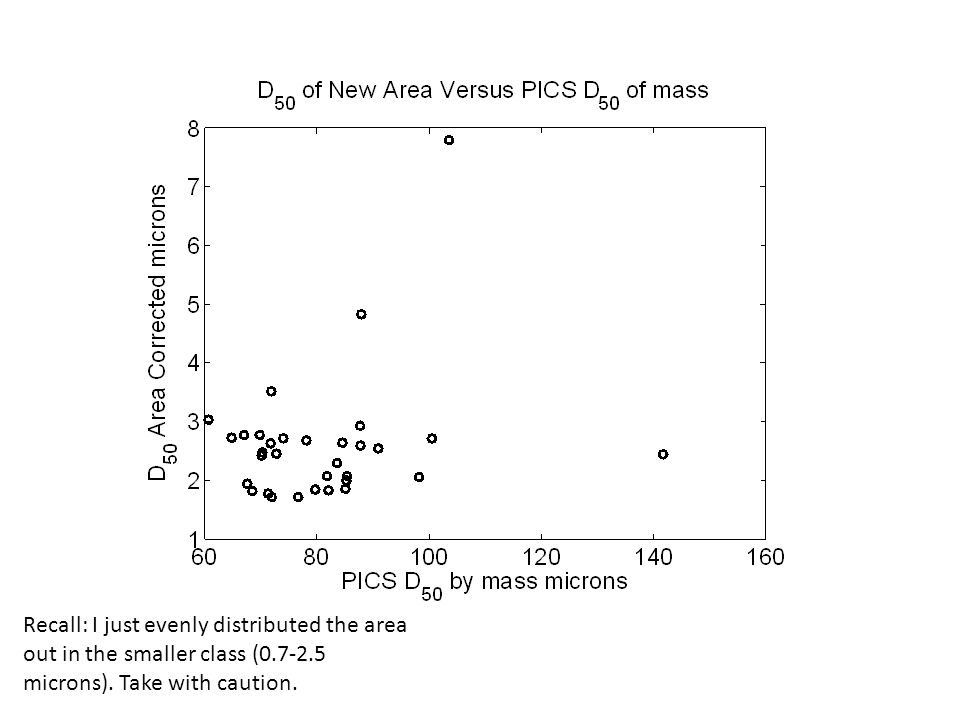
Recall: I just evenly distributed the area out in the smaller class (0.7-2.5 microns). Take with caution.

47
Area not corrected

48
Original New Area New Area, New D 50

49
Are these more organic? Smaller particles composition more important in influence attenuation per unit mass? D50_new of area may be incorrect.

50
Example: Sample Volume and Area Distribution form September 2014 Grainsize μm A cm 2 /L Combine PICS and LISST observations to create a larger size spectrum from 2.5-1000 μm where: 2.5-60 μm: LISST Area (red) 60-200 μm: LISST and PICS (yellow) 280-1000 μm: PICS (blue) LISST PICS Volume μL/L LISST PICS COMBINED Characterization of Particle Properties with the LISST (2.5-500 μm) and PICS (30-1000μm)
 μm: LISST and PICS (yellow) μm: PICS (blue) LISST PICS Volume μL/L LISST PICS COMBINED Characterization of Particle Properties with the LISST ( μm) and PICS ( μm)")
51
Example: Sample Volume and Area Distribution form September 2014 Grainsize μm A cm 2 /L Combine PICS and LISST observations to create a larger size spectrum from 2.5-1000 μm where: 2.5-60 μm: LISST Area (red) 60-200 μm: LISST and PICS (yellow) 280-1000 μm: PICS (blue) LISST PICS Volume μL/L LISST PICS COMBINED Characterization of Particle Properties with the LISST (2.5-500 μm) and PICS (30-1000μm)
 μm: LISST and PICS (yellow) μm: PICS (blue) LISST PICS Volume μL/L LISST PICS COMBINED Characterization of Particle Properties with the LISST ( μm) and PICS ( μm)")
Similar presentations


 analysis.>")


>")
 and have.>")

, M ira Morović 1* (optical), Frano Matić 1,>")