Download presentation
Presentation is loading. Please wait.

1
1 Ross Santy Director, Performance Information Management Service U.S. Department of Education EDFacts Consolidating and Using K-12 Performance Data within the U.S. Department of Education

2
2 What is EDFacts? EDFacts is a U.S. Department of Education (ED) initiative to collect, analyze, report on and promote the use of high-quality, kindergarten through grade 12 performance data. These data are used in education planning, policymaking, and management and budget decision-making to improve education programs. EDFacts centralizes data provided by state education agencies (SEAs) on state, local education agency (LEA), and school demographics, program participation and performance outcomes.
 initiative to collect, analyze, report on and promote the use of high-quality, kindergarten through grade 12 performance data. These data are used in education planning, policymaking, and management and budget decision-making to improve education programs. EDFacts centralizes data provided by state education agencies (SEAs) on state, local education agency (LEA), and school demographics, program participation and performance outcomes..")
3
3 Local ED Agencies ED OCR Aggregate stats on equitable distribution of services by gender and race/ethnicity. Collected directly from local education agencies What Was (How ED Collected Data) State ED Agencies NCES Aggregate stats on enrollment, graduation and dropouts. Plus school and district directory information. At the state, district and school levels OSEP Aggregate stats on participation in and compliance with Indivd. w/ Disabilities Act (IDEA) at the state level OESE Aggregate stats on participation in and compliance with Title programs in Elementary and Secondary Education Act (ESEA) Surveys Local Student Information Systems
 State ED Agencies NCES Aggregate stats on enrollment, graduation and dropouts. Plus school and district directory information. At the state, district and school levels OSEP Aggregate stats on participation in and compliance with Indivd. w/ Disabilities Act (IDEA) at the state level OESE Aggregate stats on participation in and compliance with Title programs in Elementary and Secondary Education Act (ESEA) Surveys Local Student Information Systems.")
4
4 Local ED Agencies ED OCR Aggregate stats on equitable distribution of services by gender and race / ethnicity. Collected directly from local education agencies What Is (How ED Collects Data) State ED Agencies NCES Aggregate stats on enrollment, graduation and dropouts, program participation and performance. Plus school and district directory information. At the state, district and school levels OSEPOESE Local Student Information Systems State Longitudinal Data Systems (students) Other State Systems
 State ED Agencies NCES Aggregate stats on enrollment, graduation and dropouts, program participation and performance. Plus school and district directory information. At the state, district and school levels OSEPOESE Local Student Information Systems State Longitudinal Data Systems (students) Other State Systems.")
5
5 Facts about EDFacts EDFacts does not collect individual student- or staff-level information. All information provided to EDFacts is aggregated at the school, district, or state level. None of the information is personally identifiable to individual students or staff members. The EDFacts Data Governance Board within ED meets monthly to address discrepancies in data definitions, address data quality issues and approve changes to the data set. The board includes official representatives from K-12 program offices across ED and reports up to the Secretary’s Policy Committee.

6
6 Types of Data Within EDFacts General Information – School, District Directory, Charter Schools, Student and Staff Counts Assessments – State assessment results in reading/language arts, math and science (general and alternate assessments) Accountability – AYP Status, Determinations by subgroup, Improvement Status/Actions Students with Disabilities (IDEA) – Child Count, Exiting, Discipline, Assessments, Removals, Staffing ESEA Title I – School Improvement Grants, Public School Choice, Supplemental Ed Services, Student Participation, Staffing, Graduation Rates ESEA Title III – Student Participation, English Language Attainment, Monitored Former LEP students Career/Technical Education Concentrators (Perkins) – Secondary Indicators Graduates/Completers, Dropouts, Teacher Quality, Computer Access, Homeless, Neglected or Delinquent, Migrant, Safe and Gun Free Schools
 Accountability – AYP Status, Determinations by subgroup, Improvement Status/Actions Students with Disabilities (IDEA) – Child Count, Exiting, Discipline, Assessments, Removals, Staffing ESEA Title I – School Improvement Grants, Public School Choice, Supplemental Ed Services, Student Participation, Staffing, Graduation Rates ESEA Title III – Student Participation, English Language Attainment, Monitored Former LEP students Career/Technical Education Concentrators (Perkins) – Secondary Indicators Graduates/Completers, Dropouts, Teacher Quality, Computer Access, Homeless, Neglected or Delinquent, Migrant, Safe and Gun Free Schools")
7
7 Key Steps in Getting Here IDEA “618 Reporting” Congruency Studies (starting SY 2004-05) Consolidated State Performance Report (starting SY 2004-05) NCES Common Core of Data (starting SY 2006-07) EDFacts Regulation (January 2007) Perkins CAR (2011)
 Consolidated State Performance Report (starting SY ) NCES Common Core of Data (starting SY ) EDFacts Regulation (January 2007) Perkins CAR (2011)")
8
8 Primary Goal for EDFacts Help the policy and program offices to make better use of the one set of data – Prior data uses had been based entirely at the SEA level of data – Accountability under NCLB led to reporting and use of LEA and school level data – Program office capability was not built around availability of LEA and school level data – Data review and validation became a key process hurdle

9
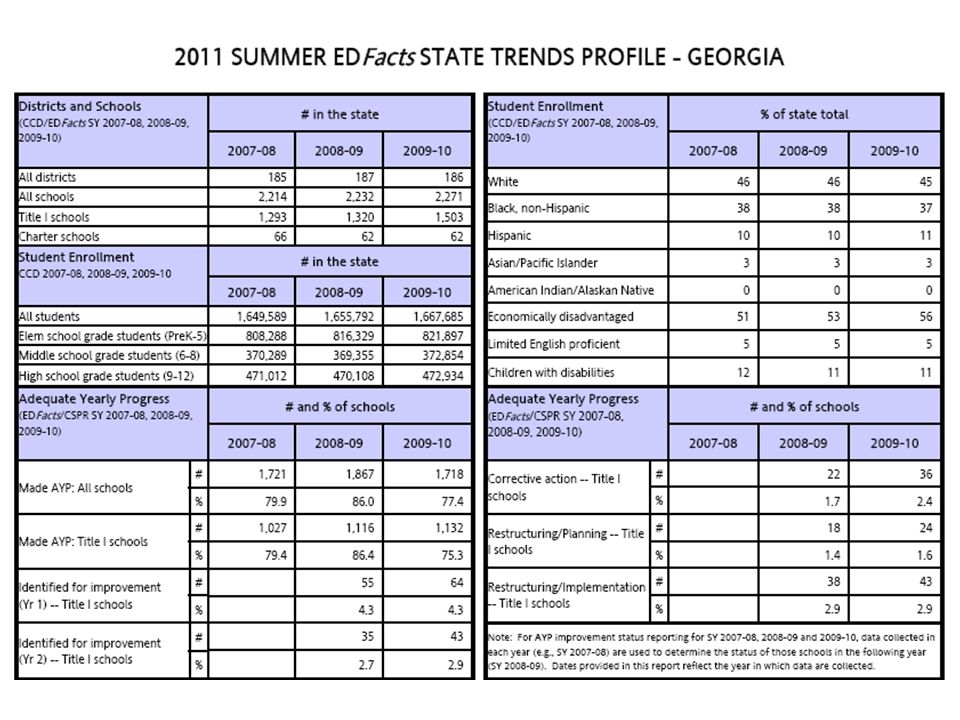
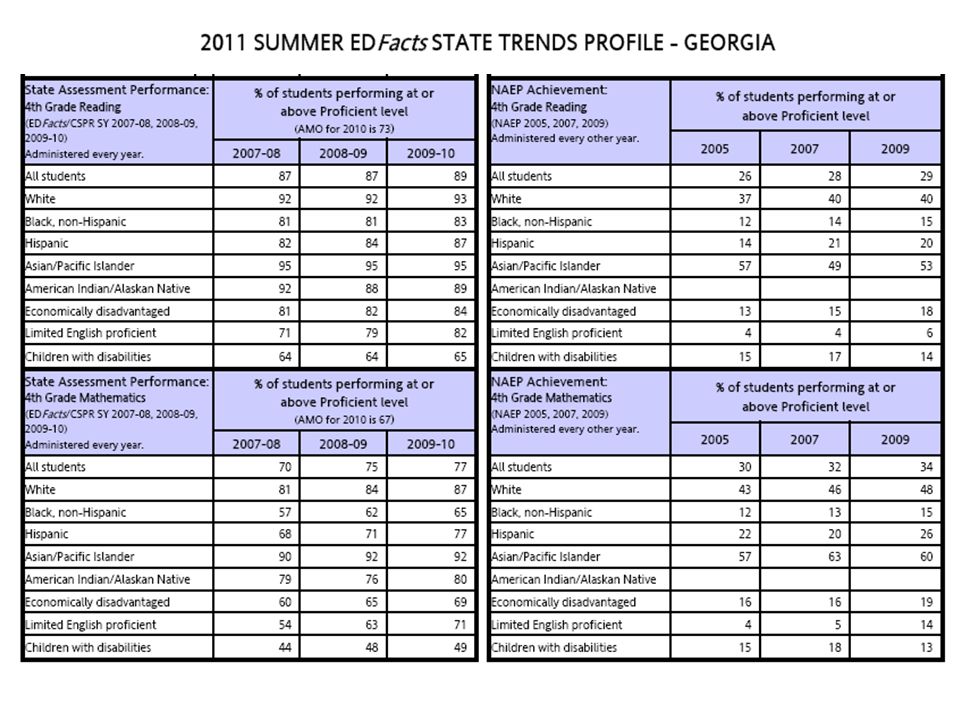
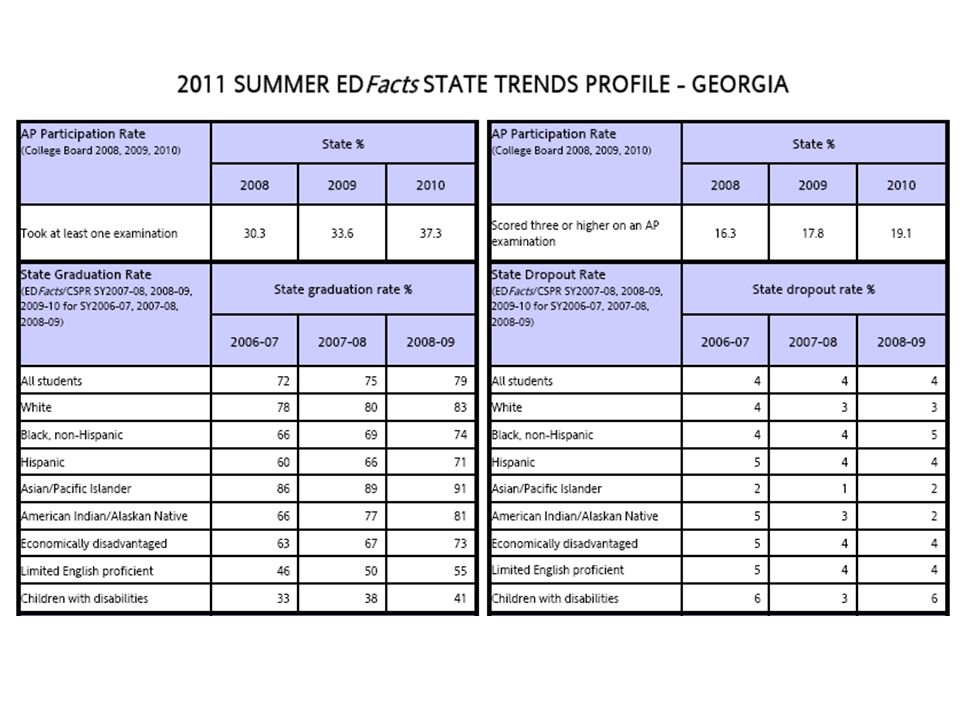
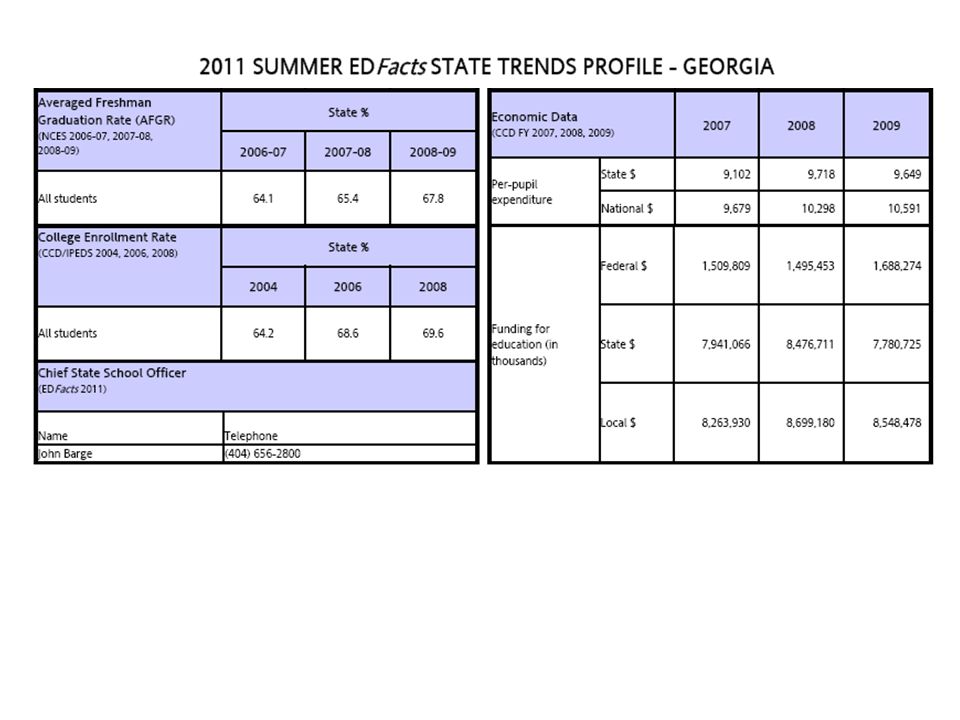
9 Uses of EDFacts Data Generating the NCES Common Core of Data and other public data State and Congressional District Profiles Data “exploration” as part of policy analysis and policy development process Powering evaluations and studies with data reported to EDFacts

10
10 PUBLIC DATA

11
11 http://nces.ed.gov/ccd

12
12 http://www.ideadata.org

13
13 http://eddataexpress.ed.gov

14
14 PROFILES

20
20 DATA “EXPLORATIONS”

21
21 Question: How many Hispanic students participate in ED programs?

22
22 Transitioning Reporting by Race/Ethnicity

23
23 EVALUATIONS AND STUDIES

24
24 Internal Data Quality: Title I Participation 548670 Asian or Pacific Islander Black (not Hispanic) White (not Hispanic) American Indian or Alaska Native HispanicAsianBlackNative Hawaiian or Other Pacific Islander Two or more races WhiteDG 548 Grand Total DG 670 Grand Total ALABAMA1488108932158510339215246 346320288354 ALASKA 2188227522937193212883063186795253339927 ARIZONA5430204626027113951174816 274930280191 ARKANSAS 17862458828556050911773312160794255021268650 BUREAU OF INDIAN EDUCATION 47740 CALIFORNIA 303712266744239268297161310275736949596652202123475321 COLORADO37491399854200278695154 169887201355 CONNECTICUT3174298452877544139253 128745102117 DELAWARE186924370283532359254 64081 DISTRICT OF COLUMBIA766522781738288705 6354261158 FLORIDA220214007113622824209423428 12502051253286 GEORGIA 19871232631580943321377523648291785890480885986 HAWAII859512372196507625441 114187125077 IDAHO1249128275578207124279 104459101641 ILLINOIS149452273861675721332256872 682151694064 INDIANA25515288011589870627770 212678219173 2 Data Groups on Title I Participation: Data Group 548: The cumulative unduplicated number of students participating in and served by Title I of ESEA, Part A, Sections 1114 (Schoolwide Programs (SWP)) and 1115 (targeted assistance (TAS) programs). By Race/Ethnicity and subgroups Data Group 670: The cumulative unduplicated number of students participating in and served by programs under Title I, Part A of ESEA as amended.

25
25 Internal Data Quality: Title I Participation DG 548DG 670% Difference 548 and 670 American Indian or Alaska Native AsianBlackHispanicNative Hawaiian or Other Pacific Islander Two or more races WhiteGrand Total (DG 548) Grand Total (DG 670) GA LEA 1124614353 501431247323415.6% GA LEA 21 260491 15589135612369.7% GA LEA 315277162 511049154514327.9% GA LEA 4 330437 3674143867.3% GA LEA 57663664111 1381772575857210.6% GA LEA 612548151 371958222021921.3% GA LEA 727240942102443343808637961004.6% GA LEA 8167978997432226829891285574.1% GA LEA 96191073285 481222265324757.2% GA LEA 10410309217 521931252324035.0% GA LEA 11 1542026 338561350119513.0% GA LEA 126754681222647280526456.0% GA LEA 13 1414 6304356 0.0% GA LEA 143111328241470949260624795.1% GA LEA 15513450361511520207619745.2% GA LEA 16141331698 58886201519980.9% GA LEA 171390274336210244434478067999-2.4% GA LEA 181310334142781630507847357.2% GA LEA 1941483788 851768279627561.5% GA LEA 20854296107912622164367534676.0% GA LEA 211267529 257327103.1% GA LEA 2238761429324223464015625060563.2% GA LEA 23 18656361 691094219820397.8% GA LEA 241524133065264815413792173298.1% GA LEA 25430766399 1461084242922209.4%
 Grand Total (DG 670) GA LEA % GA LEA % GA LEA % GA LEA % GA LEA % GA LEA % GA LEA % GA LEA % GA LEA % GA LEA % GA LEA % GA LEA % GA LEA % GA LEA % GA LEA % GA LEA % GA LEA % GA LEA % GA LEA % GA LEA % GA LEA % GA LEA % GA LEA % GA LEA % GA LEA %")
26
26 Recent Studies to Use EDFacts Data NAEP/State Assessment Alignment Study (IES) IDEA Participation and Educational Environments (IES) IDEA Services and Charter Schools (GAO) Use of Census Versus State Reported Data within the Title III Funding Formula (ED)
 IDEA Participation and Educational Environments (IES) IDEA Services and Charter Schools (GAO) Use of Census Versus State Reported Data within the Title III Funding Formula (ED)")
27
27 What is USED doing to help educational data quality? Clarify definitions – NCES Handbooks – EDFacts File Specs and Guidance Enable the automation of vertical reporting – Promote Interoperability – EDFacts Coordination Task Orders – Linkages between SLDS and EDFacts Work with the community to promote high-quality standards – Common Education Data Standards (CEDS v2.0)
.")
28
28 Impact of Longitudinally Linked ‘Microdata’ States have longitudinal student data – Significant development since 2003 when site visits were performed – Program measures under current ESEA developed from a snapshot/survey frame of reference State Fiscal Stabilization Fund – States ensure public access to longitudinal statistics by 9/30/2011 (K-12 grads enrolling in higher education) – Growth provisions of ESEA proposals also consider a longitudinal perspective
 – Growth provisions of ESEA proposals also consider a longitudinal perspective")
Similar presentations


 Oklahoma State.>")


 Michigan Department of Education Office of Psychometrics, Accountability, Research, & Evaluation Summer.>")


