Download presentation
Presentation is loading. Please wait.

1
Nitrate Discussion WRAP Meeting – Tucson, AZ January 10/11, 2006 Joe Adlhoch - Air Resource Specialists, Inc.

2
Overview How much of baseline regional haze in WRAP states is due to nitrate? How much of baseline regional haze in WRAP states is due to nitrate? What are the historical trends in nitrate concentrations? What are the historical trends in nitrate concentrations? What are the contributions of natural and manmade emissions to nitrate? What are the contributions of natural and manmade emissions to nitrate? How are emissions expected to change by 2018? How are emissions expected to change by 2018? How is visibility expected to change? How is visibility expected to change? How does this compare with the glidepath? How does this compare with the glidepath? Selected case studies Selected case studies

3
IMPROVE Monitoring Locations

4
Baseline Extinction: 20% Worst Days

5
Baseline Extinction: 20% Best Days

6
Baseline Nitrate: 20% Worst Days

7
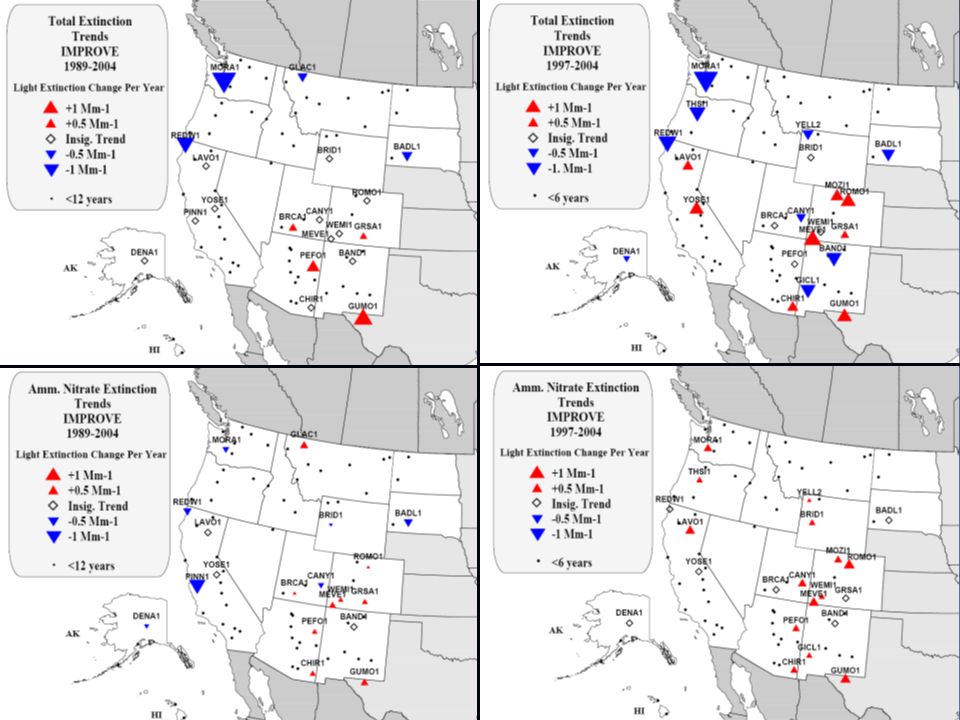
Historical Trends in 20% Worst Days: Total and Nitrate Extinction 16 year trends (1989 – 2004) required 12 complete years of data 16 year trends (1989 – 2004) required 12 complete years of data 8 year trends (1997 – 2004) required 6 complete years of data 8 year trends (1997 – 2004) required 6 complete years of data Theil slopes (Mm -1 /yr) calculated for all sites with sufficient data Theil slopes (Mm -1 /yr) calculated for all sites with sufficient data P-values of 0.2 required to identify trend as significant P-values of 0.2 required to identify trend as significant Changes in monitoring or analytical protocol over the years may affect trends Changes in monitoring or analytical protocol over the years may affect trends
 required 12 complete years of data 16 year trends (1989 – 2004) required 12 complete years of data 8 year trends (1997 – 2004) required 6 complete years of data 8 year trends (1997 – 2004) required 6 complete years of data Theil slopes (Mm -1 /yr) calculated for all sites with sufficient data Theil slopes (Mm -1 /yr) calculated for all sites with sufficient data P-values of 0.2 required to identify trend as significant P-values of 0.2 required to identify trend as significant Changes in monitoring or analytical protocol over the years may affect trends Changes in monitoring or analytical protocol over the years may affect trends")
8
16-yr Trends 8-yr Trends

11
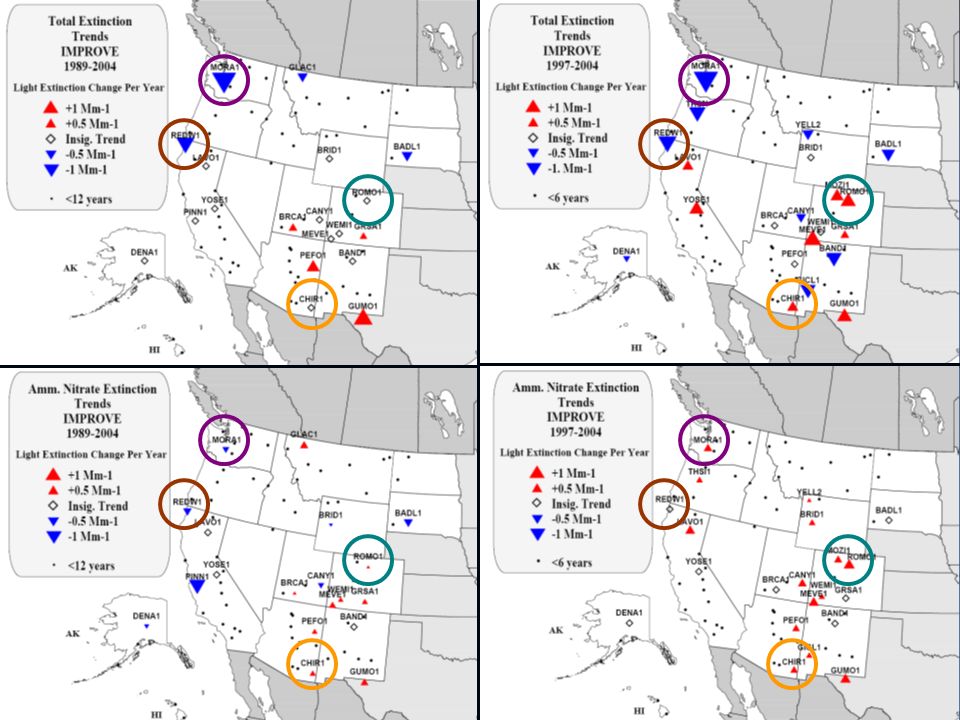
Historical Trends, 20% Worst Days Mount Rainier NP 16-yr decrease in Bext 8-yr increase in NO3 16-yr decrease in NO3

12
Historical Trends, 20% Worst Days Chiricahua NM 16-yr increase in NO3 8-yr increase in Bext

13
Historical Trends, 20% Worst Days Redwood NP 16-yr decrease in Bext 16-yr decrease in NO3

14
Historical Trends, 20% Worst Days Rocky Mountain NP 8-yr increase in Bext 8-yr increase in NO3

15
Anthropogenic and Natural NOx Emissions by State (Plan02)
")
16
Total WRAP Region SO2 and NOx Emissions (2002, 2018, and difference)
")
17
All NOx Emissions

18
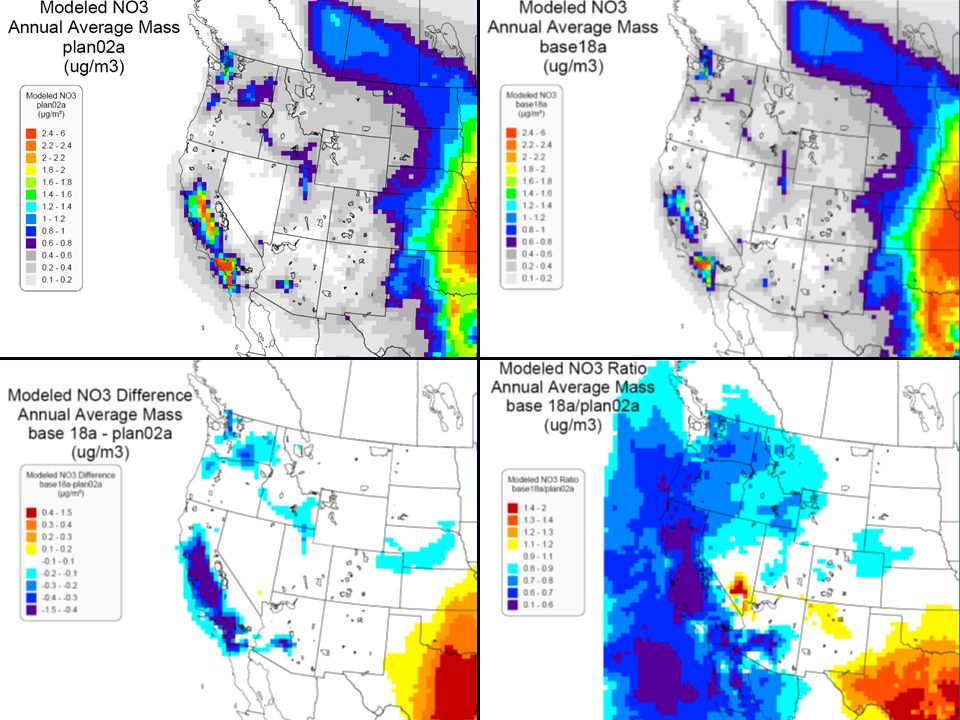
Gridded Model Results for Annual Average Nitrate Mass Annual average modeled mass (not 20% worst days) Annual average modeled mass (not 20% worst days) 2002 and 2018 2002 and 2018 Difference (2018 – 2002) Difference (2018 – 2002) Ratio (2018/2002) Ratio (2018/2002)
 Annual average modeled mass (not 20% worst days) 2002 and and 2018 Difference (2018 – 2002) Difference (2018 – 2002) Ratio (2018/2002) Ratio (2018/2002)")
19
Modeled 2002 NO3 Modeled 2018 NO3

21
Baseline and Projected 2018 Extinction: 20% Worst Days 2000 – 2004 Baseline ExtinctionProjected 2018 Extinction

22
Baseline and Projected 2018 Nitrate Extinction: 20% Worst Days 2000 – 2004 Baseline Nitrate Extinction Projected 2018 Nitrate Extinction

23
Baseline dv and Projected 2018 dv Reduction: 20% Worst Days 2000 – 2004 Baseline DeciviewsProjected 2018 Deciview Reduction

24
Variation in Baseline Deciview Values

25
Percent of 2018 Target Reduction Achieved

26
Hells Canyon, OR/ID

27
2002 NOx Emissions: Hells Canyon

28
2018 NOx Reductions: Hells Canyon

29
Model Comparison: Hells Canyon, OR

30
Hells Canyon, OR/ID2002 IMPROVE Data 2002 Model Results

31
2018 Model Changes: Hells Canyon, OR

32
Baseline Variability (dv) Baseline Variability by Species Glide Path: Hells Canyon, OR/ID
 Baseline Variability by Species Glide Path: Hells Canyon, OR/ID")
33
Medicine Lakes, MT

34
2002 NOx Emissions: Medicine Lakes

35
2018 NOx Reductions: Medicine Lakes

36
Model Comparison: Medicine Lakes, MT

37
Medicine Lakes, MT2002 IMPROVE Data 2002 Model Results

38
2018 Model Changes: Medicine Lakes

39
Baseline Variability (dv) Baseline Variability by Species Glide Path: Medicine Lakes, MT
 Baseline Variability by Species Glide Path: Medicine Lakes, MT")
40
Agua Tibia, CA

41
2002 NOx Emissions: Agua Tibia

42
2018 NOx Reductions: Agua Tibia

43
Model Comparison: Agua Tibia, CA

44
Agua Tibia, CA2002 IMPROVE Data 2002 Model Results

45
2018 Model Changes: Agua Tibia, CA

46
Baseline Variability (dv) Baseline Variability by Species Glide Path: Agua Tibia, CA
 Baseline Variability by Species Glide Path: Agua Tibia, CA")
Similar presentations
 NOx and PM Report Lee Alter Western Governors’ Association WRAP IOC NOx Issues Meeting Denver, CO July 28, 2003.>")


 2000-2010 IMPROVE DATA (for TSC 5/22/2012) Tom.>")
>")
