Download presentation
Presentation is loading. Please wait.

1
Interlock Installations in the United States and Strategies to Increase Participation 4 th Annual AIIPA Conference Denver, Colorado May 15 - May 18, 2016 Tara Casanova Powell, TIRF USA

2
Overview Annual Ignition Interlock Survey Evaluation of Ignition Interlock Programs: Interlock Use Analysis from 28 States, 2006-2011

3
Interlock Laws As of January 2016, 26 states and four California counties required all alcohol-impaired driving offenders to install an interlock. An additional 13 states required interlocks for offenders with a high blood alcohol concentration (BAC) (usually 0.15% or higher) and for repeat offenders. Six states required devices only for repeat offenders. One state (NV) required device for high-BAC offenders. Four states and D.C. did not have mandatory interlock requirements.
 (usually 0.15% or higher) and for repeat offenders. Six states required devices only for repeat offenders. One state (NV) required device for high-BAC offenders. Four states and D.C. did not have mandatory interlock requirements..")
4
Interlock Laws

5
Data All 50 states and 11 manufacturers were contacted in September 2015 to request arrest and conviction data and relevant interlock data. Counts of total installed ignition interlocks during a period of one year (12 months) in 2014, and total installed ignition interlocks in 2015 (January 1 st to August 31 st, 2015) were requested.
 in 2014, and total installed ignition interlocks in 2015 (January 1 st to August 31 st, 2015) were requested..")
6
Definitions Total installed number (TIN): the number of ignition interlock devices reported to be installed in vehicles over a period of time. Active installed number (AIN): the number of ignition interlock devices reported to be installed in a vehicle on the date designated by this request (i.e., a snapshot in time).
: the number of ignition interlock devices reported to be installed in a vehicle on the date designated by this request (i.e., a snapshot in time)..")
7
Definitions States were also requested to provide, if possible, data according to offense categories. Offense categories were defined as: First offender "basic" DWI; First offender high-BAC DWI; Refused test DWI and; Repeat DWI (2 nd and subsequent DWI).
..")
8
State Arrest Data DWI arrest data were requested to estimate the number of potentially eligible offenders in each state. Arrest data may be used to make comparisons across states and to identify yearly increases or decreases. Reporting DWI arrests by offense category identifies the incidence of arrests in relation to each DWI offense category within a state. This can be helpful to inform DWI enforcement and awareness campaigns.

9
State Arrest Data 15 states were able to provide total DWI arrest data for the reporting period from January 1 st, 2014 to December 31 st, 2014. 10 of these states were able to provide further breakdowns of arrest data by offense categories. 10 states were able to provide total DWI arrest data for the reporting period from Jan. 1 st to August 31 st, 2015. 7 of these states were able to provide further breakdowns of arrest data by offense categories.

10
State Conviction Data DWI conviction data were requested to further identify the potential number of eligible offenders in each state. Conviction data may be used to make comparisons across states and to identify yearly increases or decreases. Conviction data compared to arrest data is used to identify the number of individuals arrested for a DWI who are subsequently convicted. This is useful information to inform the planning of state DWI awareness and enforcement campaigns.

11
State Conviction Data 16 states were able to provide total DWI conviction data for January 1 st to December 31 st, 2014. 9 of these states further reported breakdowns of conviction data by offense categories. 11 states were able to provide total DWI conviction data for January 1 st to August 31 st, 2015. 7 of these states were able to further breakdown conviction data by offense categories. Illinois was able to report all repeat offender DWI convictions (all 2+ offenders).
..")
12
State Interlock Data State TIN for 26 states that reported interlock data for January 1 st to December 31 st, 2014 was 141,787. State TIN for 26 states that reported interlock data for January 1 st to August 31 st, 2015 was 110,487. State AIN for 26 states that reported interlock data for December 31 st, 2014 was 77,909. State AIN for 26 states that reported interlock data for August 31 st, 2015 was 88,194.

13
Manufacturer Data Manufacturer TIN for 8 manufacturers that reported interlock data for January 1 st to December 31 st, 2014 was 256,150. Manufacturer TIN for 8 manufacturers who reported interlock data for January 1 st to August 31 st, 2015 was 191,479. Manufacturer total AIN for 8 manufacturers who reported interlock data for December 31 st, 2014 was 309,919. Manufacturer total AIN for 8 manufacturers who reported interlock data for August 31 st, 2015 was 328,743.

14
Manufacturer TIN 2014

15
Manufacturer TIN 2015

16
Manufacturer AIN December 31, 2014

17
Manufacturer AIN August 31, 2015

18
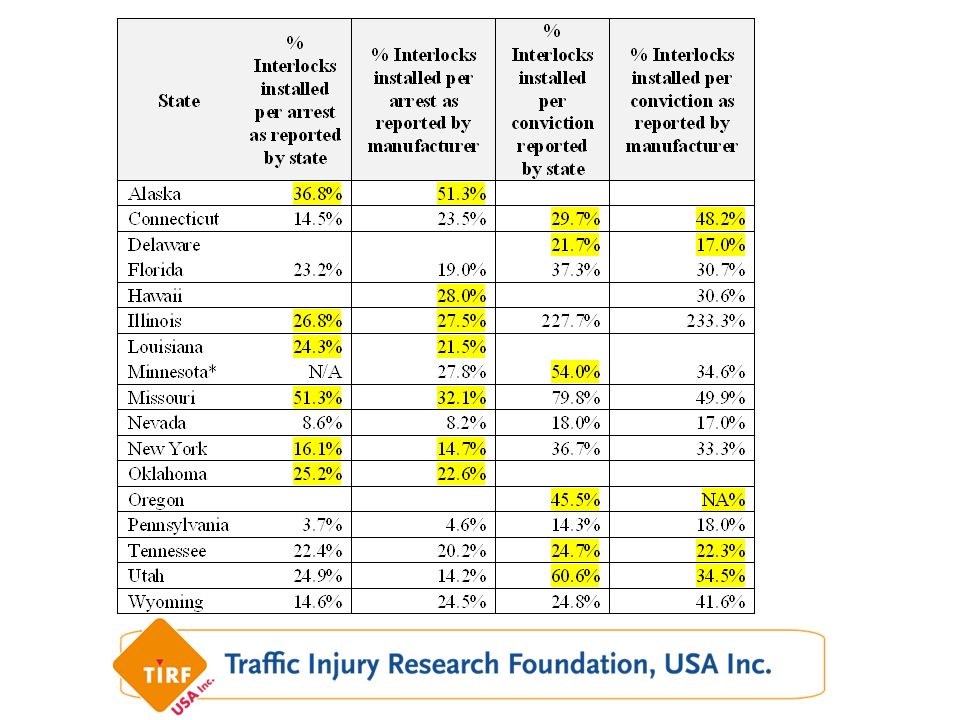
Offender Eligibility Interlock program effectiveness may be measured by the percentage of those offenders who actually installed an interlock among those who were eligible or required to do so. Dependent upon legislation in a state, the eligible population of offenders who are required to install may include: offenders arrested for a DWI (if an administrative license suspension or revocation requires an interlock) or; offenders convicted of a DWI which is dependent upon offense categories that require an interlock. This assumes that offenders are not deemed ineligible for other driving violations unrelated to DWI.
 or; offenders convicted of a DWI which is dependent upon offense categories that require an interlock. This assumes that offenders are not deemed ineligible for other driving violations unrelated to DWI..")
20
Discussion Barriers that can impede the ability of states to provide data: data capture processes vary across agencies and jurisdictions; many states lack centralized or standardized data collection; often linkages between court data and DMV data are limited; several states do not have the resources. Few states were able to provide data other than TIN and AIN. Several states were unable to respond or provide any data during the allotted timeframe. Few states were able to provide a breakdown by offense category numbers.

21
Discussion Accurate records and timely reporting are essential to successful interlock programs (Casanova Powell et al. 2015). Implementing automated record systems and central repositories has been shown to improve the availability of data in states such as Florida and Colorado, however even these states have room for improvement. If more states were able to provide these data, more informative statistics could be calculated and used to evaluate progress of state interlock programs.
. Implementing automated record systems and central repositories has been shown to improve the availability of data in states such as Florida and Colorado, however even these states have room for improvement. If more states were able to provide these data, more informative statistics could be calculated and used to evaluate progress of state interlock programs..")
22
Acknowledgements

23
Eight Potential Keys to Higher Interlock Use NHTSA/CDC/GHSA funded study. Conducted by PRG. Program design: requirements & penalties; Program management: monitoring, uniformity, coordination & education; Program support: resources & data.

24
Correlations of Interlock Program Key Ratings with Interlock In-Use Rates, 2011

25
Interlock Use Change Results Required interlocks for first offenders: use increased in all 3 states (FL, KS, NY). Required interlocks for repeat or high-BAC offenders: use increased in 3 of 4 states (MI, WV, WI, decreased in VA). Required interlocks for hardship license: use increased in 2 of 3 states (IL, LA, IA-no change).
. Required interlocks for hardship license: use increased in 2 of 3 states (IL, LA, IA-no change)..")
26
Interlock Use Change Results Interlock to reduce/eliminate license suspension period: use increased in all 6 states (AR, CO, IA, OR, WA, WV). Management and other changes: use increased in 7 states (CA, CO, FL, MO, NM, OK, WA).
..")
28
California In 2009 regulatory authority to administer mandatory IID programs was transferred from state courts to DMV. 2010-2015: All offenders in pilot program required to install an IID; Legislation also allowed repeat offenders throughout the state to obtain restricted driving privileges after a hard suspension period (90 days for second offense, six- month suspension for 3 rd + offense). Formerly, repeat offenders required a one-year suspension with no provision for early restriction.
. Formerly, repeat offenders required a one-year suspension with no provision for early restriction..")
29
Colorado 2007: Mandatory for all high-BAC offenders at 0.17; Extended mandatory interlock period for high-BAC and repeat offenders to 2 years; 4 months compliance based removal; Introduced highly incentivized, voluntary 1st offender program. 2010: Online Interlock System Uploads/transfers interlock installation certificates, calibrations, removals, interlock data logs, violations & circumventions. Confirms offender eligibility/verifies offenders install. OIS administers financial assistance program for indigent offenders. PDD Committee – program assessment, education, and training.

30
New Mexico 2005: Mandatory interlocks for all DWIs: 1yr for 1 st ; 2 for 2 nd ; 3 for 3 rd ; lifetime for 4+. 2007: Out of state drivers with out of state convictions seeking NM license must complete interlock period. 2008: Penalties for circumvention attempts. 2009: The New Mexico Interlock Memorial created a task force; led to required 6 months of tamper-free interlock driving prior to license reinstatement. 2010: NMDOT established indigency requirements for interlock orders as well as allowed administrative funding for NMDOT to oversee the program.

31
Washington 2004: IID required for all DWI offenders. 2009: IID driver license law permits driving during suspension with IID. 2010: IID service center and technician certification, NIST certified testing devices, unified reporting and standardized calibration procedures. 2011: Compliance based removal (4 months violation-free). 2013: IID requires camera. Legislative interlock workgroups meet yearly to discuss how to enhance the effectiveness of the interlock program.
. 2013: IID requires camera. Legislative interlock workgroups meet yearly to discuss how to enhance the effectiveness of the interlock program..")
32
Program Successes Legislative changes – laws and penalties: As state interlock programs evolve, states are learning what works and what does not. Many states have improved interlock laws/programs and are working to close program gaps. Monitoring offenders: Data: States with a central repository allow for easily accessible data to efficiently monitor offenders and impose sanctions for violations in a timely manner (e.g., FL and CO).
..")
33
Program Successes Uniformity and coordination: Stakeholder involvement: States are moving to bridge gaps between agencies involved in interlock program through creation of inter- agency task forces which include representatives from the judicial, administrative and law enforcement agencies.

34
Program Successes Education: Educating law enforcement, judges, prosecutors, probation officers, treatment providers, and driver licensing agency staff can improve stakeholder interest and facilitate more effective and efficient program implementation. Data/resources: Without the ability to access reliable, shared data, program managers are unable to efficiently execute and evaluate their program, or monitor offenders.

35
Questions?

36
Contact Tara Casanova Powell taracp@tirf.us 203-809-8709

Similar presentations


 Project Closeout Presentation January 27, 2010.>")


 sentencing, impact on Wisconsin motor vehicle crashes? IID.>")


 goal, which is backed by associations of State.>")
