Download presentation
Presentation is loading. Please wait.

1
1 Early Childhood Transition: Facts, Figures, Fantasies and the Future Objectives 1. To share selected findings based on the SPP/APR and NECTC study 2. To hear state experiences 3. To identify resources and assistance 4. To enable participant discussion

2
2 Session Presenters Kathy Whaley, NECTAC Beth Rous, NECTC Phyllis Mondak, Section 619, VA Ron Dughman, MPRRC on behalf of NM Karen Mikkelsen, NERRC

3
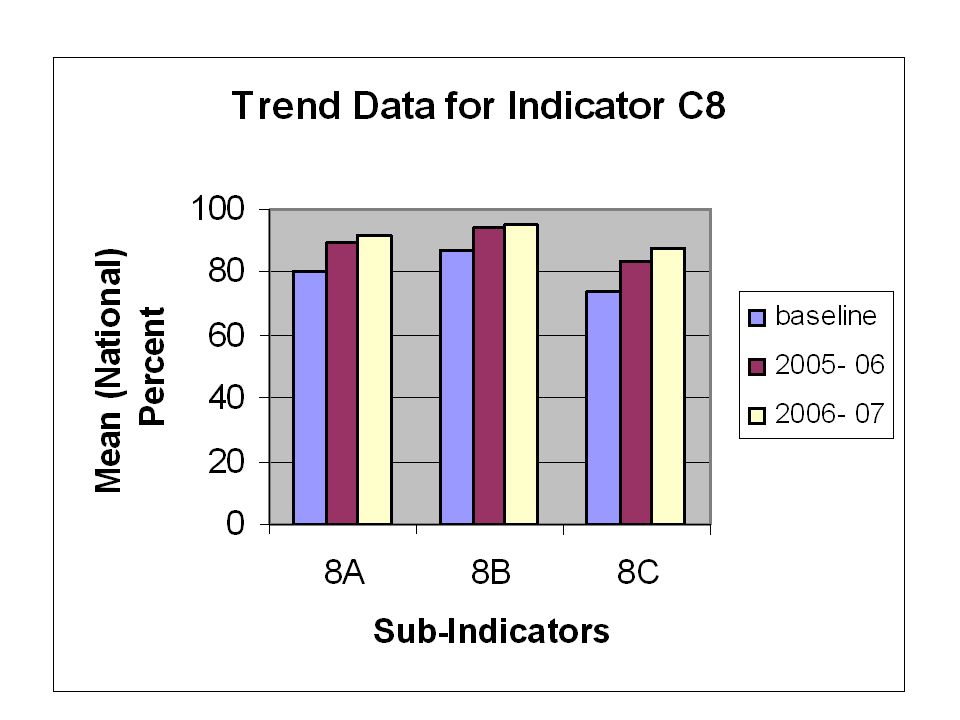
3 Indicator C8: Early Childhood Transition Summary of 06-07 APR

4
4 C8: Early Childhood Transition Percent of all children exiting Part C who received timely transition planning to support the child’s transition to preschool and other appropriate community services by their third birthday including: – (A) IFSPs with transition steps and services – (B) Notification to LEA, if child potentially eligible for Part B; and – (C) Transition conference, if child potentially eligible for Part B.
 IFSPs with transition steps and services – (B) Notification to LEA, if child potentially eligible for Part B; and – (C) Transition conference, if child potentially eligible for Part B.")
5
5 Overall Trends Across Sub indicators More states report higher rates of compliance in notifying LEAs of potentially eligible children (8B) and documenting transition steps within the IFSP (8A) than for holding transition conferences (8C) More states report full compliance regarding Notification to LEA (8B)and report substantial compliance. All states reported data on all sub indicators.

7
7 Progress IFSP Steps (8A) – 30 states made progress (8 maintained 100%) Notification (8B) – 22 states made progress (8 maintained 100%) Conference (8C)– 32 states made progress (4 maintained 100%)
 – 30 states made progress (8 maintained 100%) Notification (8B) – 22 states made progress (8 maintained 100%) Conference (8C)– 32 states made progress (4 maintained 100%)")
8
8 Progress attributed to: 8A Clarification of policies, specific training/TA Improved monitoring/data processes to include sub indicator requirements Revised IFSP forms 8B Improved data sharing procedures and data entry accuracy; Systematized notification protocols; increased frequency of reports Improving local collaboration Targeted training of Service Coordinator/Data Managers 8C Utilization of focused monitoring/improved data collection Training/TA and policy clarification

9
9 Slippage IFSPs with Transition Steps/Services (N=11) Notification to LEA (N=13) Transition Conference (N=17) Reasons given: – Inaccurate or changing data systems/sources – Issues of data entry and reporting – IFSPs needed elements and instructions for documenting transition – Unclear policies – Staff shortages
 Notification to LEA (N=13) Transition Conference (N=17) Reasons given: – Inaccurate or changing data systems/sources – Issues of data entry and reporting – IFSPs needed elements and instructions for documenting transition – Unclear policies – Staff shortages")
10
10 Themes Improving data collection, record keeping, data analysis and data sharing Clarifying policies and aligning the consistency of policies across C and 619 Improving communication and collaboration across Part C and 619 Training and TA linked to monitoring and correction of non-compliance. Collaborative and joint training efforts with Part B, Section 619

11
11 Indicator B12: Early Childhood Transition Summary of 06-07 APR

12
12 B12: Early Childhood Transition Percent of children referred by Part C prior to age 3 and who are found eligible for Part B, and who have an IEP developed and implemented by their third birthday.

13
13 Overall Trends Across Indicator States show steady progress by national average of reported data (from baseline 72% to FFY 06-07 84%) Changes to data systems decreased performance for some states but considered more accurate
 Changes to data systems decreased performance for some states but considered more accurate")
14
14 Progress and Slippage 37 states reported progress 11 states reported slippage 3 states maintained 100%

15
15 Progress Attributed To: Changes in Data Collection Procedures and Systems Changes in Monitoring Processes and Linkage to Improved Data Capacity Improved Collaboration with Part C Clearer Policies and Guidance Intensive Targeted TA

16
16 Slippage Attributed to: FFY 05-06 Data considered inflated or incomplete for purposes of analysis Selection of monitoring sites in cycle Staffing and personnel issues

17
17 Themes Better data! Better monitoring of compliance requirements MOUs and improved collaboration with Part C Clarified policies and guidance Collaborative training and TA Inconsistencies across states in policies regarding reasons for delay

18
18 Additional Resources National Early Childhood Transition Initiative http://www.nectac.org/topics/transition/ectransitionta.asp National Early Childhood Transition Center http://www.ihdi.uky.edu/nectc/ NECTAC Resource Collection on Transition from Part C to Preschool http://www.nectac.org/topics/transition/transition.asp SPP/APR Calendar: Technical Assistance Related to SPP Indicators and Determinations http://spp-apr- calendar.rrfcnetwork.org/techassistance.html http://www.nectac.org/topics/transition/ectransitionta.asp http://www.ihdi.uky.edu/nectc/ http://www.nectac.org/topics/transition/transition.asp http://spp-apr- calendar.rrfcnetwork.org/techassistance.html

Similar presentations
 and>")
>")


>")


>")


