Download presentation
Presentation is loading. Please wait.

1
OHIO UNIVERSITY LEADERSHIP PROGRAM TREASURER’S COHORT SEMINAR OHIO UNIVERSITY ENDEAVOR CENTER PIKETON, OHIO OCTOBER 28, 2010 PRESENTED BY: JANET SMALLEY

2
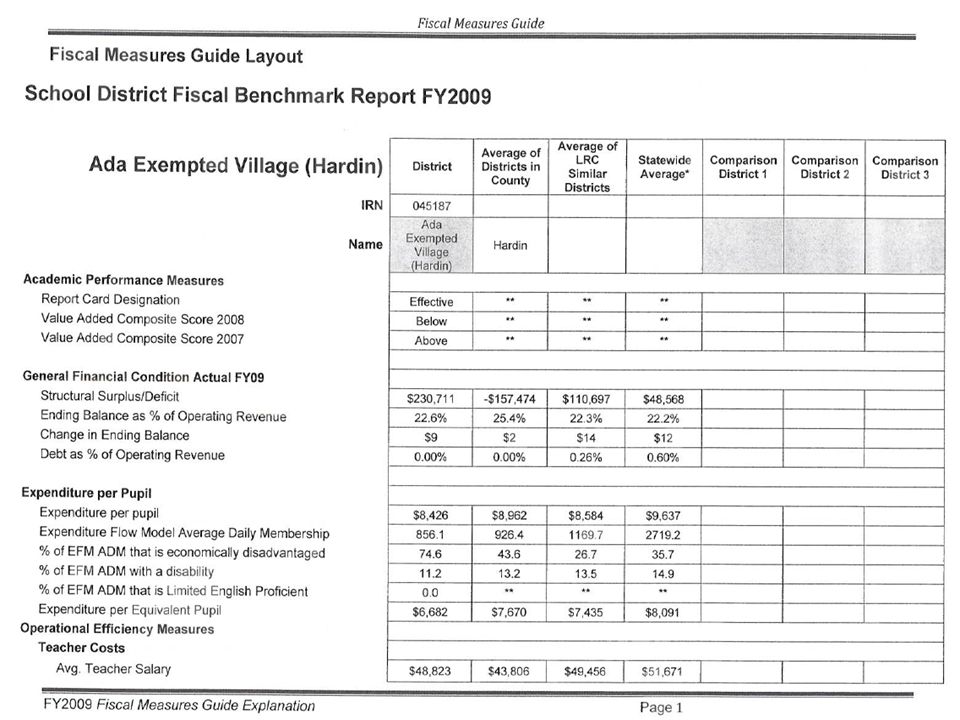
School District Benchmarking Report

3
Introduction Spending and reporting requirements to provide insight on how districts manage the resources provided by the state. Two key dimensions –Educational dimension involves how money is spent to directly support activities in the classroom –Operational dimension involves how money is spent to support the operations of schools

4
Intent to provide a framework to provide districts with the ability to evaluate the operating costs of the district and identify possible areas for improvement in the allocation of district resources All districts are required to report financial data to ODE within the system of revenue and expenditure codes defined by the Ohio Auditor of State in the Uniform School Accounting System (USAS) manual ODE is currently working with the Auditor of State and district treasurers to develop more consistent reporting standards
 manual ODE is currently working with the Auditor of State and district treasurers to develop more consistent reporting standards")
7
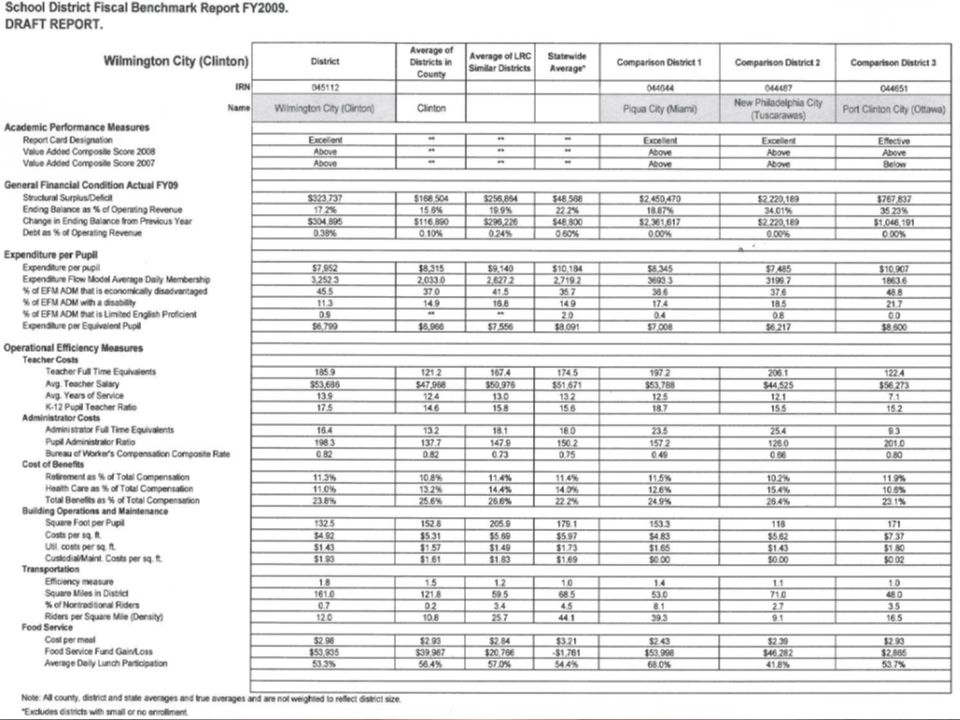
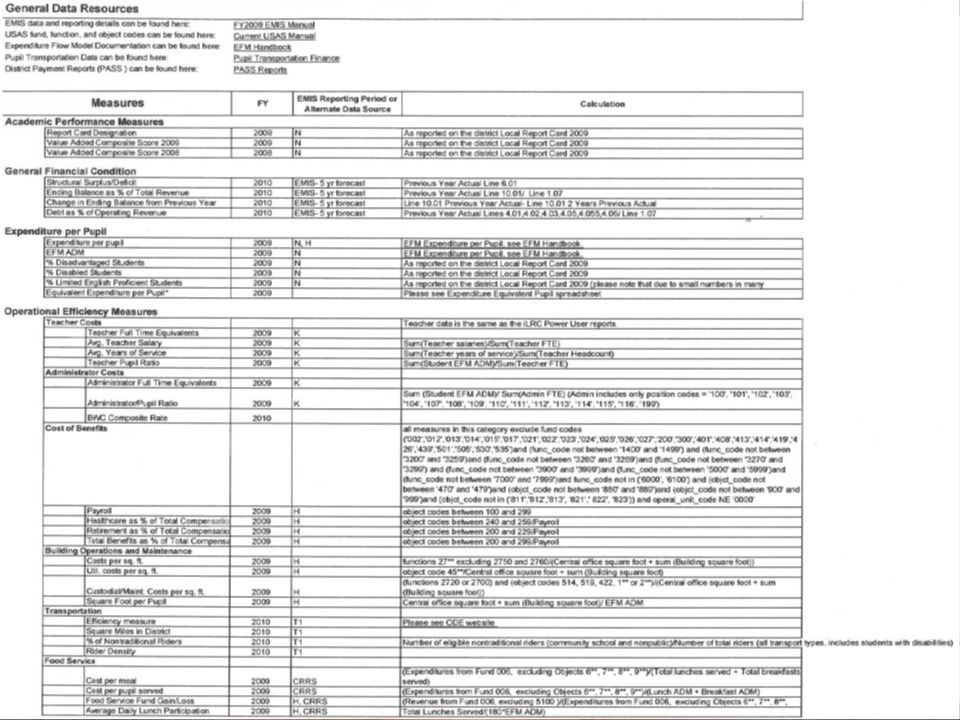
How to Create a District Benchmarking Report The District Benchmarking Report is an Excel workbook consisting of four worksheets: 1.Report – this worksheet provides the primary benchmarking and comparative data 2.Report_Trend – this worksheet provides two years of trend data for a single district 3.Data Info – this worksheet provides technical details on the data source and calculations used for the benchmarking report 4.Expenditure Equivalent Pupil – this worksheet provides details on the data source and calculations for the expenditure per equivalent pupil benchmark

8
Average of Local Report Card Similar Districts Similar districts are a unique group of up to 20 “similar districts” that are most similar according to certain criteria. –District size –Poverty level –Socioeconomic status (median income, education, occupational data) –Factors related to urban or rural location –Overall property wealth
 –Factors related to urban or rural location –Overall property wealth.")
9
State Results (%) An average of results for all Ohio traditional public school districts, excluding the island districts and College Corner, that submitted FY2009 June data or Financial data. Community schools and joint vocational school districts are not included in this average

10
Understanding the Benchmarks: Academic Performance Measures Report Card Designation: In August of each year, the district report card is released which provides an overall measure of the districts academic performance Value Added Composite Score: Value added measures the growth in student learning over the course of a year For accountability purposes, the state has grouped the results of the value added computation into three classification bands. “Above” means students have mastered more learning in the year set by state-level expectations. “Met” means students have mastered the learning in the year set by state-level expectations. “Below” means students have mastered less learning in the year than the state-level expectations

11
Expenditure Per Pupil ODE uses the Expenditure Flow Model (EFM) to report per-pupil spending for Ohio’s schools The model uses the districts’ end-of-year financial reports
 to report per-pupil spending for Ohio’s schools The model uses the districts’ end-of-year financial reports")
12
Expenditure Per Pupil This number represents the overall expenditure of the district for all district operations and includes instructional programs, staff development (professional development programs), student support services (e.g. health service, guidance services), administration (e.g. central office, principals) and operating expenses (e.g. transportation, maintenance, utilities)
, administration (e.g. central office, principals) and operating expenses (e.g. transportation, maintenance, utilities).")
13
Expenditure Flow Model Average Daily Membership The average daily membership is an annual measure of the number of students enrolled in the district

14
% of EFM ADM that are Economically Disadvantaged A student is considered to be economically disadvantaged if the student is eligible for a free or reduced price lunch (the student’s family income is less than 185% of the federal poverty rate)
")
15
% of EFM ADM with a Disability District’s are required to identify and offer services to any student with a disability to help alleviate any barriers created by the disability

16
% of EFM ADM that is Limited English Proficient Students with Limited English Proficiency require additional services in order to develop language skills and complete the educational program

17
Expenditure per Equivalent Pupil The expenditure per equivalent pupil provides a comparison that offsets differences caused by characteristics of the students as opposed to the operations of the district

18
Operational Efficiency Measures

19
Teacher Costs Average Teacher Salary: For every staff member listed as a teacher, this is the sum of the annual salaries for all teachers divided by the number of full time equivalent teachers Average Years of Service: Comparing the average salary between districts; differences in teacher salary may be due to difference in the average length of service K-12 Pupil Teacher Ratio: This is the ratio of the ADM to the full time equivalent teachers in the district

20
Administrator Costs Pupil Administrator Ratio: This is the ratio of ADM to the number of administrators in the district Bureau of Worker’s Compensation Composite Rate: The composite rate is presented as measure of the comparative cost between districts and is impacted by historical claims and the districts participation in BWC rate reduction programs

21
Cost of Benefits Retirement as % of Payroll: School districts contribute a percentage of each covered employees salary into the appropriate public pension plan Health Care as % of Payroll: The cost of health insurance plans is influenced by the types of insurance offered and program costs Total Benefits as % of Payroll: School districts contribute a percentage of each covered employees salary into an unemployed insurance fund. In addition, total benefits will include other employer provided benefits such as reimbursement for employee education, uniforms or tools, and employee recognition awards

22
Building Operations and Maintenance Square Foot per Pupil: The square foot includes space available in all district buildings, including any buildings used to provide office space for the central administration (superintendent, treasurer, etc.) or operational support (bus garage, maintenance shop, etc.) Cost per sq. ft: The cost per square foot measures the operational costs to operate and maintain the buildings in a district Utility costs per sq. ft: The utilities cost per square foot measures the cost of providing gas, electricity, water, sewage and other utilities necessary to operate the buildings Custodial/Maint. Costs per sq. ft: The custodial and maintenance costs per square foot include the cost of staff hired to care and maintain the buildings, garbage removal, and supplies for the upkeep of the buildings

23
Transportation Efficiency measure: Number of regular education students that are transported on a school bus Square Miles in District: The number of square miles within the district’s boundary % of Nontraditional Riders: School districts are generally required to provide transportation services to students who live in the district but attend chartered non-public (private) schools and community schools Riders per Square Mile (Density): Rider per square mile is calculated by dividing the district’s actual bus riders by its size in square miles
 schools and community schools Riders per Square Mile (Density): Rider per square mile is calculated by dividing the district’s actual bus riders by its size in square miles")
24
Food Service Cost per meal: Dividing the total operating expenses charged to the food service fund by the number of meals served Food Service Fund Gain/Loss: Difference between the revenue that is deposited into the food service fund and the operating expenses charged to the fund Average Daily Lunch Participation: Rate is the number of lunches served during the school year divided by the ADM times 180 days which is used to approximate the number of days lunch is served

25
How to Find Benchmark Report on ODE website: www.ode.state.oh.us Finance Special Finance Date Reports Education Fiscal Data Project District Fiscal Benchmark Report

28
Subhead text… Body text

29
Questions???

Similar presentations


 State School Fund Ways & Means Education Sub-Committee March 24, 2003 Pat Burk, Deputy Superintendent Brian Reeder,>")


 2008 The McGraw ‑ Hill Companies 1 School District Budgeting.>")


