Download presentation
Presentation is loading. Please wait.

1
Stars and the HR Diagram Dr. Matt Penn National Solar Observatory

2
Outline How do we form an HR diagram? –Absolute brightness (Luminosity) –Temperature (Spectral class) Where are most stars? Why? What happens when stars evolve over time? What does an HR diagram of a star cluster tell us?
 –Temperature (Spectral class) Where are most stars. Why. What happens when stars evolve over time. What does an HR diagram of a star cluster tell us .")
3
The basic problem… When we try to understand the life of a star, we face a harder problem than a mosquito trying to understand a human life.

4
The basic problem… Human life = 3,000 mosquito lives Stellar life = 100,000,000 human lives We cannot sit back and watch; we need a different approach We use the laws of physics and a few observable quantities to understand the lives of stars

5
The basic problem… Let’s say the mosquito takes the same approach. The mosquito wants to measure two things for each person: color of hair, and height of the person. The mosquito makes a graph of these two things and hopes to learn about the lives of people this way.

6
The basic problem… To measure the height of each person without flying there, what else must the mosquito know?

7
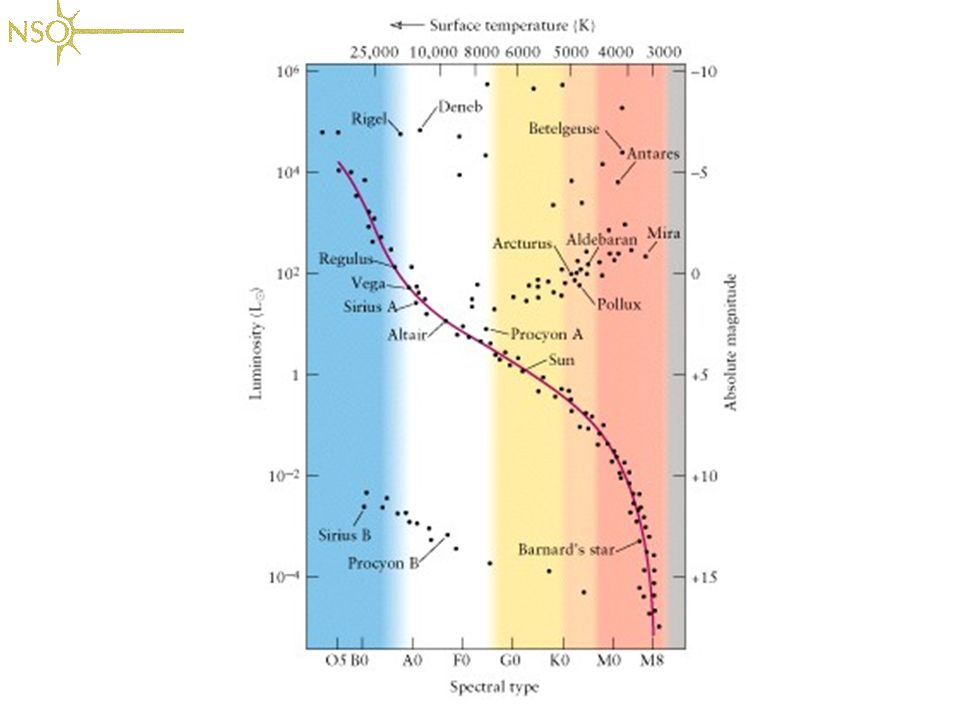
The HR diagram The tool we use to study stars is called the Hertzsprung-Russell diagram. It plots two observable quantities: the absolute brightness of a star and the temperature of a star. Combined with some laws of physics, the HR diagram provides a way to understand how stars evolve with time.

9
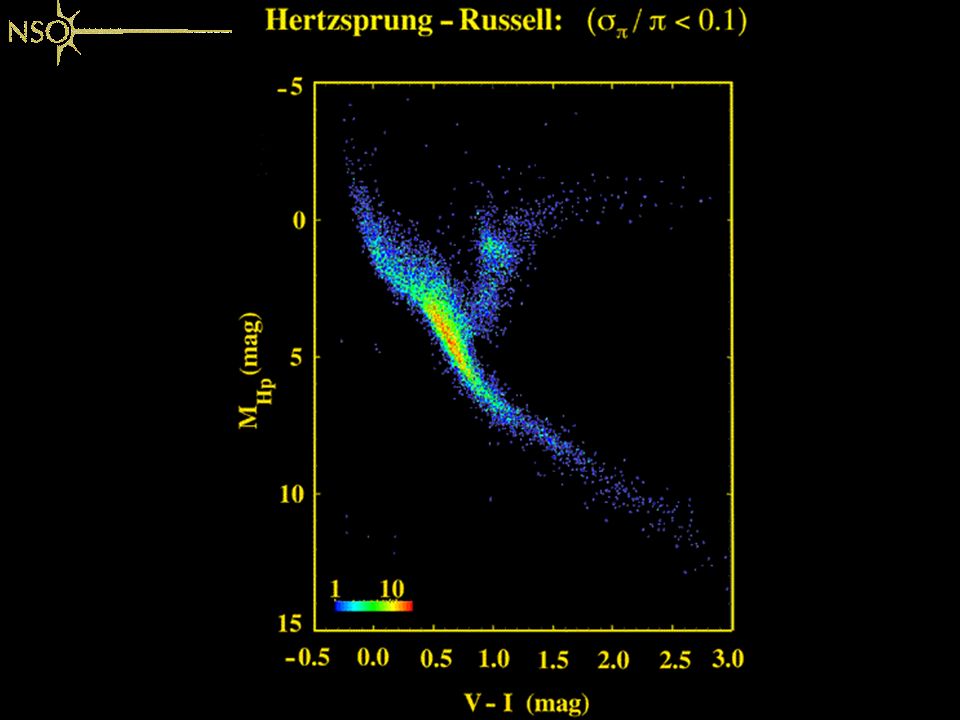
The HR diagram Most stars lie along the “Main Sequence” –Simple relationship between temperature and luminosity –Stars spend most of their lives converting hydrogen to helium, and this is what occurs when the star is on the main sequence An HR diagram of the closest 16,000 stars shows most lie along MS

12
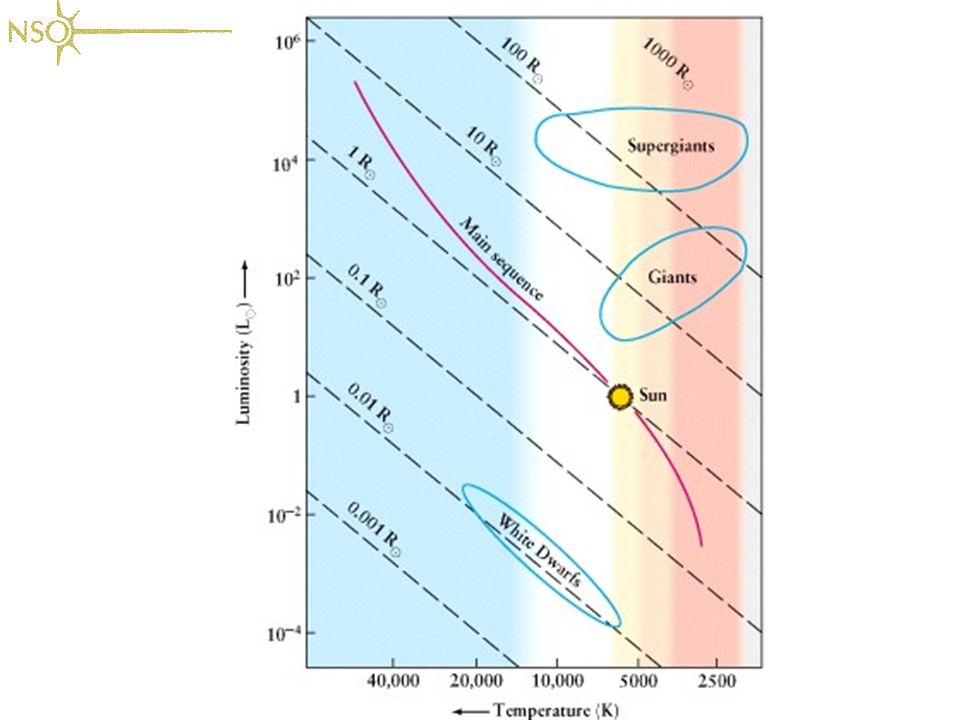
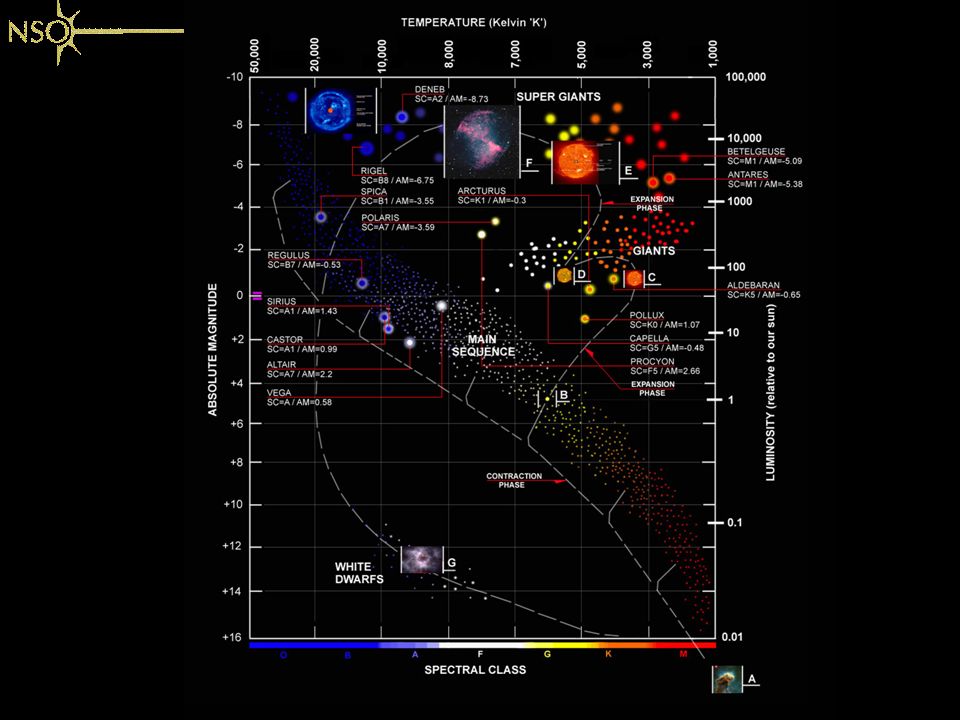
The HR diagram Stars in the upper right are very large and stars in the lower left are very small. This defines only the SIZE of the star and not the MASS, since the density of stars can be very different. So the branch of stars to the upper right of the MS are giant and supergiant stars.

14
Stellar Evolution: 1 solar mass The “job” of a star is to balance the crushing force of gravity by producing an internal pressure by releasing energy from atomic fusion reactions. When the star can no longer balance gravity, or changes the way it makes internal pressure, we say that the star evolves.

15
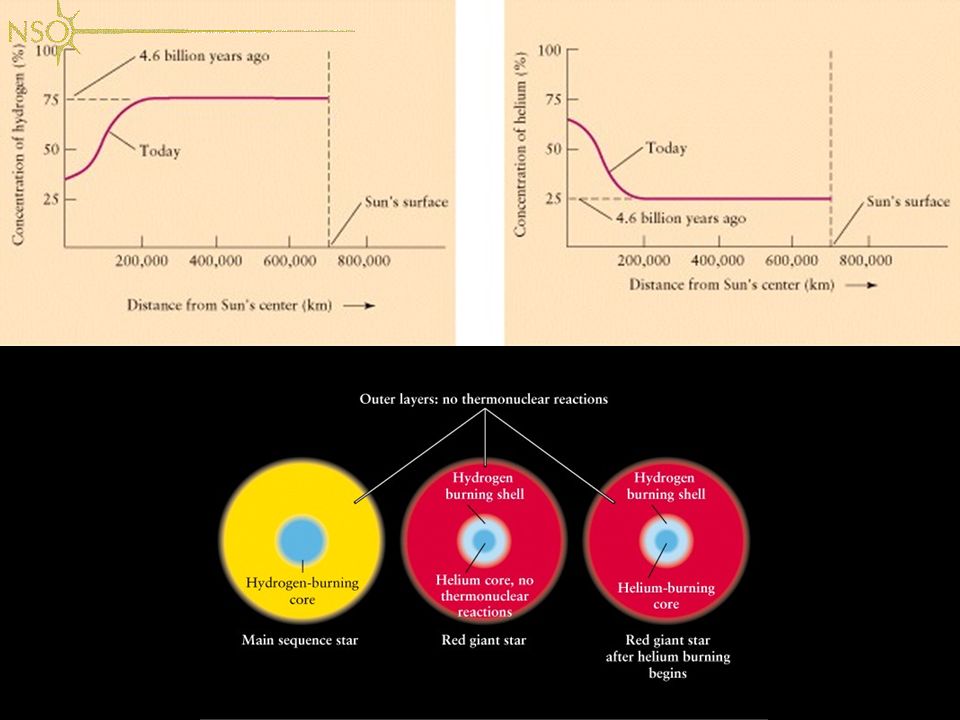
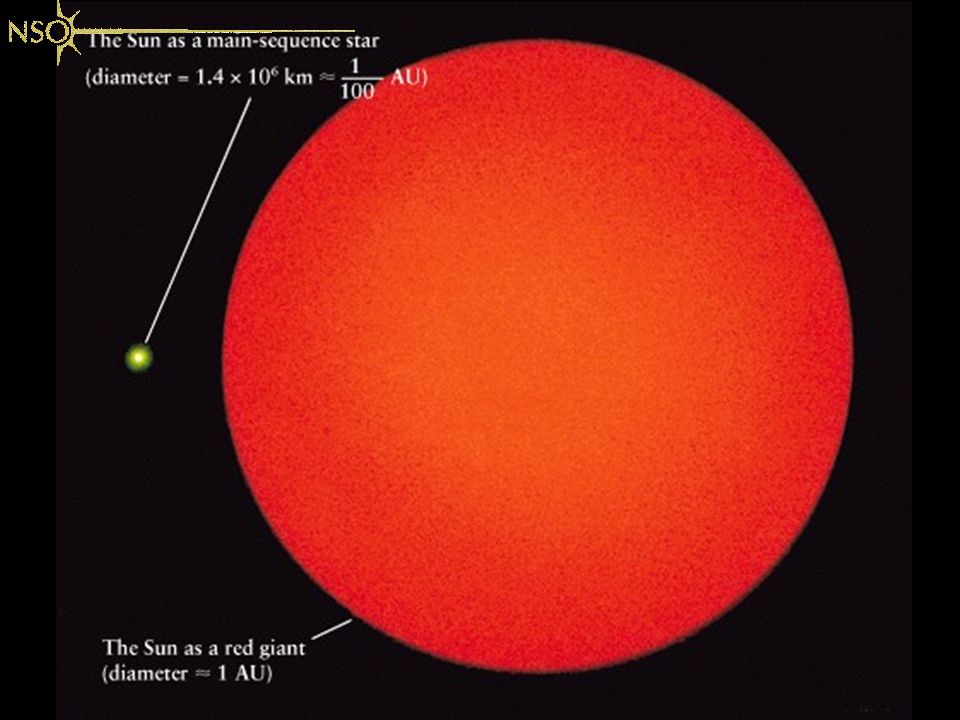
Stellar Evolution: 1 solar mass Using physics and computer models, we can predict the evolution of stars. The changes which occur in a star even with the same mass as the Sun are profound. Inside, the core of the Sun will run out of hydrogen atoms and eventually turn to helium atoms for energy production.

18
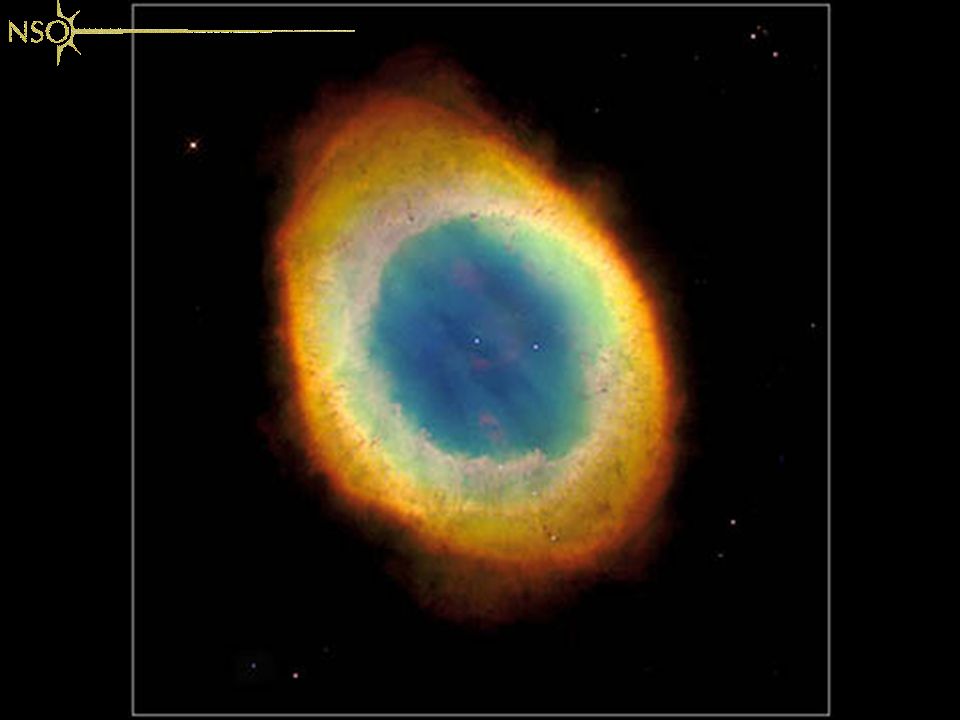
Stellar Evolution: 1 solar mass Eventually the Sun can no longer produce internal pressure with fusion reactions; the Sun runs out of energy. The envelope is ejected, and the core of the Sun forms a very dense, solid white dwarf star. A famous planetary nebula with a white dwarf in the center is M57

20
Stellar Evolution: 1 solar mass The evolution of a one solar mass star, from the main sequence through the giant phase to a white dwarf, can be traced on a HR diagram.

21
Stellar Evolution: 1 solar mass

22
Stellar Evolution: 2 to 5 solar mass The internal structure, and the evolution of a star varies depending on initial mass

23
Stellar Evolution: 2 to 5 solar mass Higher mass stars are much much hotter; they use up their supply of hydrogen much faster than the Sun. A higher mass star can use helium for nuclear fusion, and with the higher temperatures

24
Stellar Evolution: 2 to 5 solar mass High mass stars can use heavy elements and can produce nuclei of carbon, oxygen and nitrogen in their core. The nuclei of all carbon, oxygen and nitrogen atoms in the Universe were produced inside the cores of massive stars at earlier times.

25
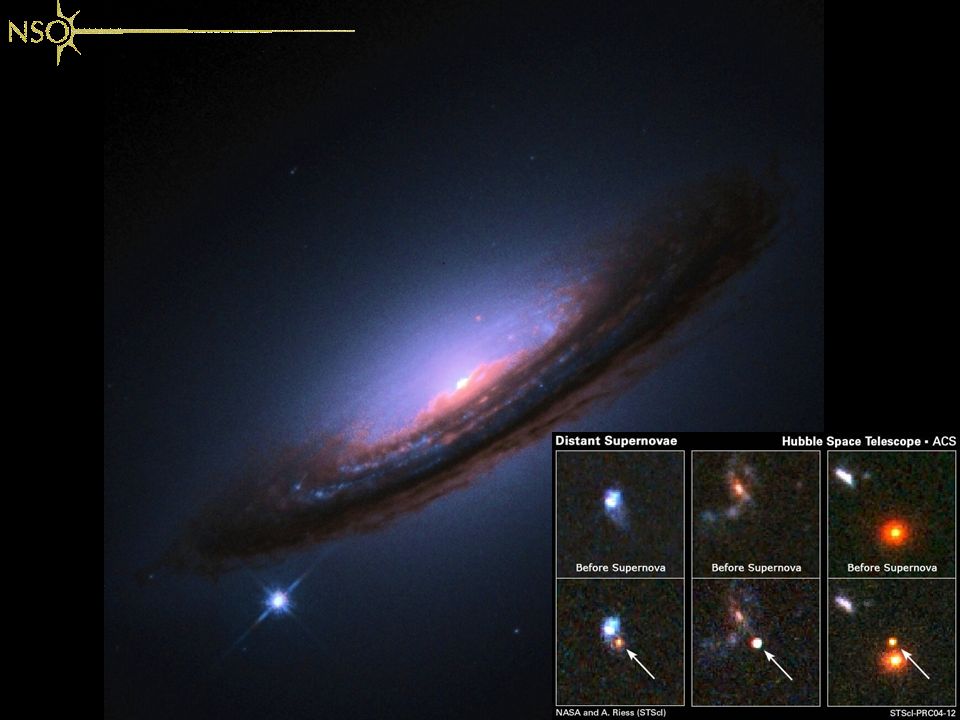
Stellar Evolution: 2 to 5 solar mass When a higher mass star can no longer produce internal pressure, it ejects the envelope in a violent explosion called a supernova. Supernova are so bright they can shine brighter than an entire galaxy, and they can be seen across the visible universe.

27
Stellar Evolution: 2 to 5 solar mass Gas thrown off during SN explosions forms remnant nebulae and glows for long times

28
Stellar Evolution: 2 to 5 solar mass The collapsing core of a high mass star forms a neutron star, usually in the form of a pulsar, a rapidly rotating stellar remnant which can appear to blink hundreds or thousands of times per second. The most famous pulsar is in the Crab nebula

30
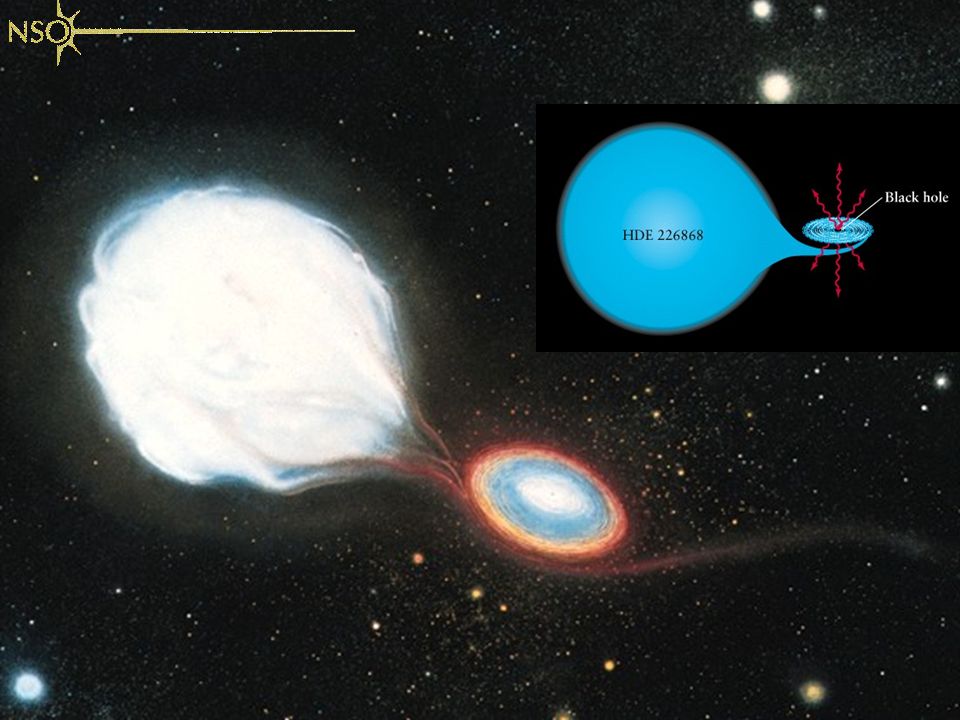
Stellar Evolution: 5+ solar mass Stars with initial masses greater than 5 solar masses or so produce violent supernova explosions. The cores of these stars are so massive that they continue collapsing past the neutron star phase and form black holes.

31
Stellar Evolution: 5+ solar mass Since black-holes cannot be directly observed, the best support for their existence comes from observations of X-ray binaries. The high temperatures and small size of the X-ray emitters can only be found in the accretion disk surrounding a black hole.

33
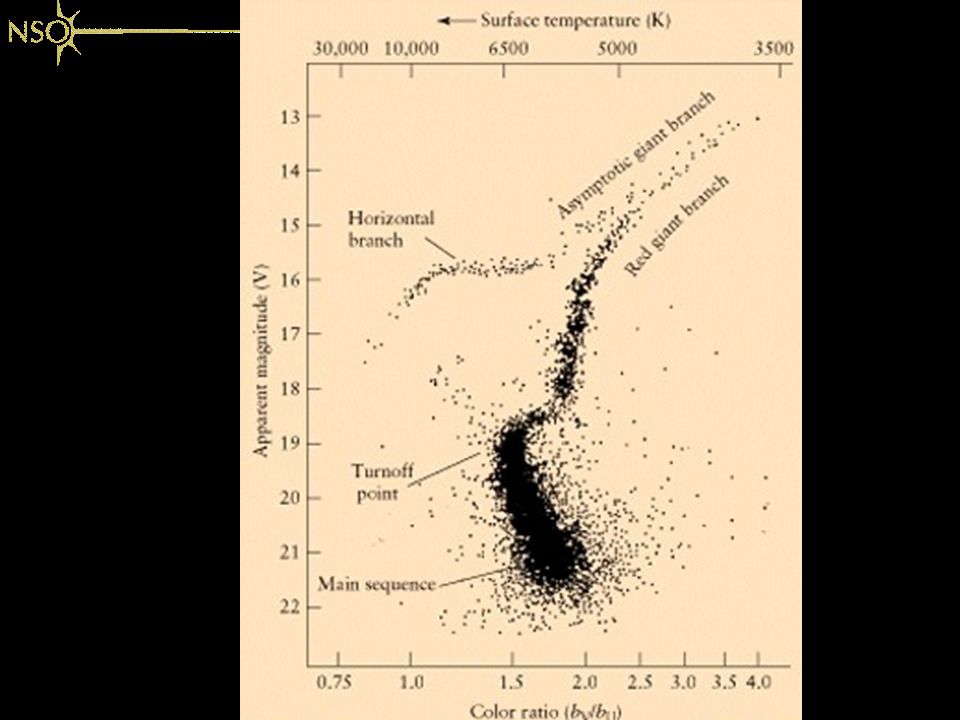
Globular Clusters and HR Diagram Stars in a globular cluster are all thought to form at roughly the same time. The stars in a globular have different initial masses, and so they will evolve at different rates. If we make an HR diagram of the stars in a cluster, we see stars in various stages of evolution.

35
Globular Clusters and HR Diagram By looking at the turn-off point from the Main Sequence, we can estimate the age of the stars in the cluster. Turn-off point stellar mass age

36
Summary Parallax and spectroscopy help us measure the luminosity and temperature of a star. Plotting the luminosity vs temperature gives us an HR diagram. The Main Sequence, where most stars fall in the HR diagram, is where stars convert hydrogen to helium.

37
Summary We can estimate the radius and the mass of stars based on their position in the HR diagram Evolution of stars occurs as stars run out of fuel and this can be traced on the HR diagram HR diagrams of star clusters help us determine the age of the clusters.

Similar presentations