Download presentation
Presentation is loading. Please wait.

1
What kind of plants do we see in a climax community? Agenda for Thursday Oct 13 th 1.Root word quiz 2.Go over HW 3.Communities notes 4.Review stuff Quiz Tuesday! – cycles, biomes, succession, communities

2
Community Def. – interacting populations in an area at the same time Different organisms occupy different biomes – Different adaptations – Different communities around the world

3
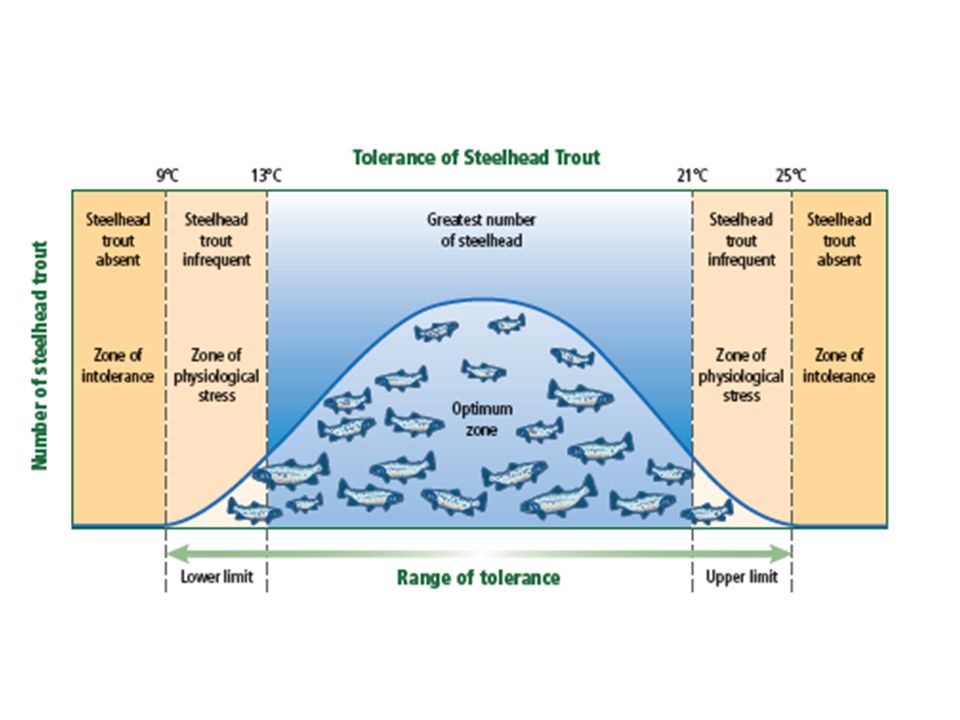
Communities Limiting factors – any biotic or abiotic factor that limits the number, reproduction, or distribution of an organism – Sunlight, food, temperature, acidity of soil Tolerance – ability of an organism to survive when subjected to abiotic or biotic factors – Upper and lower limit = range

5
What is a population? Agenda for Monday Oct 17 th 1.Population notes 2.Go over HW Quiz tomorrow Final root word quiz next Thursday Ecology test Next Friday

6
Populations – members of a single species that live in once place at a single time Why study populations? – Learn how organisms change over time, how many individuals are born, how many die, and relationships between organisms

7
Population Ranges Species might not expand due to abiotic or biotic conditions Abiotic conditions TemperatureHumidity RainfallSunlight Biotic conditions Predators Competitors parasites

8
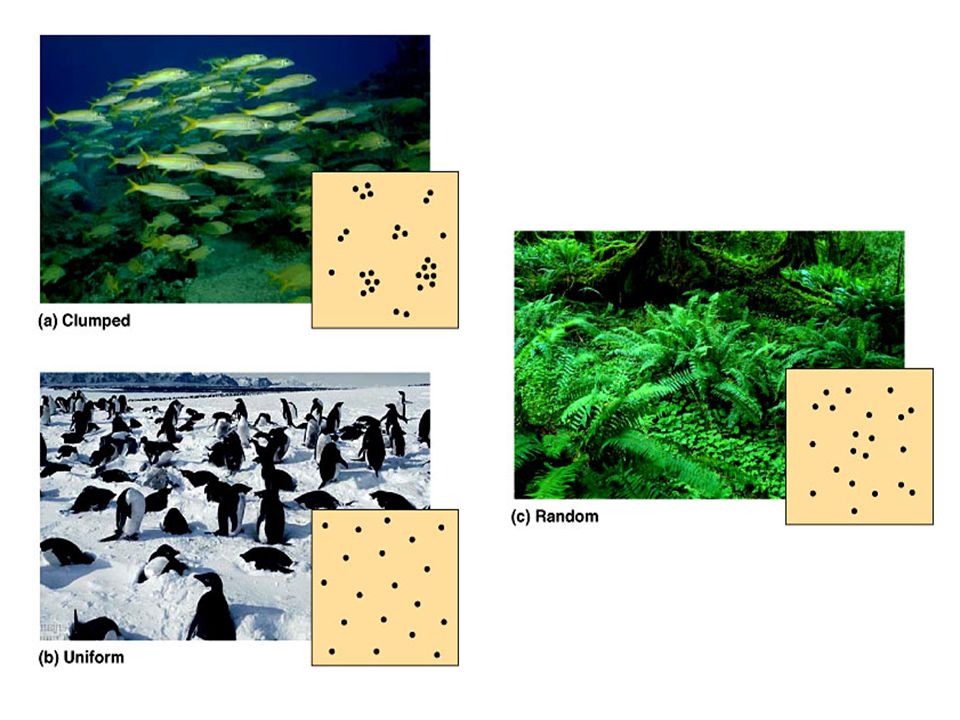
Population Characteristics Population Density – # of organisms per area Dispersion – pattern of spacing of populations – Based on available resources (food, sunlight), predators, etc – 3 types Uniform Clumped Random Which one provides most protection?
, predators, etc – 3 types Uniform Clumped Random Which one provides most protection")
9
Dispersion Pattern: Uniform

10
Dispersion Pattern: Clumped

11
Dispersion Pattern: Random

13
Population Growth Rate How do we figure out population growth rate? Must know birthrate and mortality Emigration – moving out of a pop. Immigration – moving into a pop. – Immigration rate = emigration rate Calculating growth rate =(population at end – population at beginning) Population at beginning
 Population at beginning.")
14
Exponential Growth Rate Occurs when organisms have ideal conditions More individuals = faster growth Rarely happens – WHY? – Limiting factors – food, space

15
Logistical Growth Rate Populations go through a number of growth phases – Lag Phase – slow growth, low numbers – Exponential growth – rapid growth, few dying, many reproduce – Population growth slows down – Steady state – population levels, birth rate = death rate, population stays the same Lag Expone ntial Slows Steady state

16
Carrying Capacity Logistical growth rate curve Maximum number of individuals that an environment can support for the long term – Limited by energy, water, oxygen, nutrients available – Draw a line through steady state it will give you carrying capacity

17
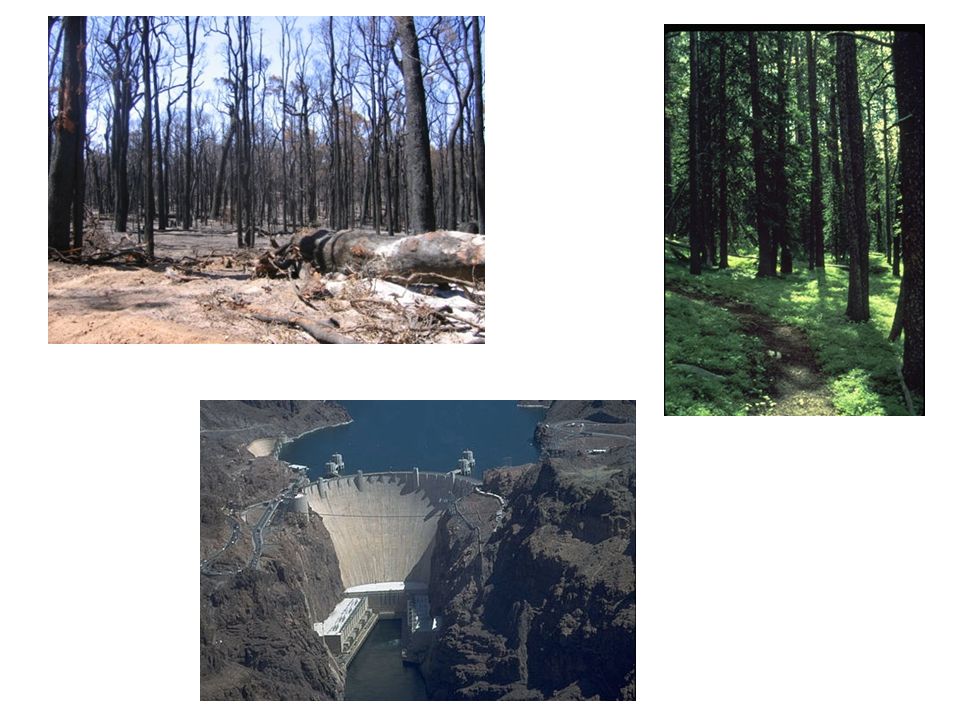
Density independent factors Def. – any factor that does not depend on the number of organisms in a population Abiotic – Weather –flooding, temp., tornados, hurricanes – Water – Fire – Sunlight – Human alterations of landscape – dams, pollution

19
Density Dependent Factors Def. – any factor that depends on the number of organisms Biotic factors – Predation, disease, parasites, competition, over crowding

20
Predation More members of a population = more predators

21
Disease/Parasites Outbreaks of disease tend to occur when population size has increased – Disease is transmitted faster – True for humans as well as animals Parasites increase at higher densities

22
Competition When resources become limited animals compete – Within a population or between 2 different species – Lead to starvation – population can decrease

23
Reproductive strategies R-strategy (rate strategists) Produce as many offspring as possible in a short time – Little energy in raising young K-strategists (carrying capacity strategy) Few offspring that have a better chance of living – Expend a lot of energy raising young
 Produce as many offspring as possible in a short time – Little energy in raising young K-strategists (carrying capacity strategy) Few offspring that have a better chance of living – Expend a lot of energy raising young")
24
List 3 factors that might limit a population’s range. Agenda for Tuesday Oct 18 th 1.Quiz 2.Outside

25
List a density independent factor and a density dependent factor. Agenda for Monday Oct 24 th 1.Go over quiz 2.Review Root word quiz Thursday Test Friday

26
Question You are given the task to determine the number of sunfish in Horseshoe Lake. Discuss with your lab partner how would you accomplish this task.

27
Sampling A technique called sampling is sometimes used to estimate population size. Organisms in a few small areas are counted and projected to the entire area. Example: A biologist counts 10 squirrels living in a 200 square foot area, she could predict that there are 100 squirrels living in a 2000 square foot area.

28
Questions 1.A biologist collected 1 gallon of pond water and counted 50 paramecium. Based on the sampling technique, how many paramecium could be found in the pond if the pond were 1,000 gallons? 2.What are some problems with this technique? What could affect its accuracy?

29
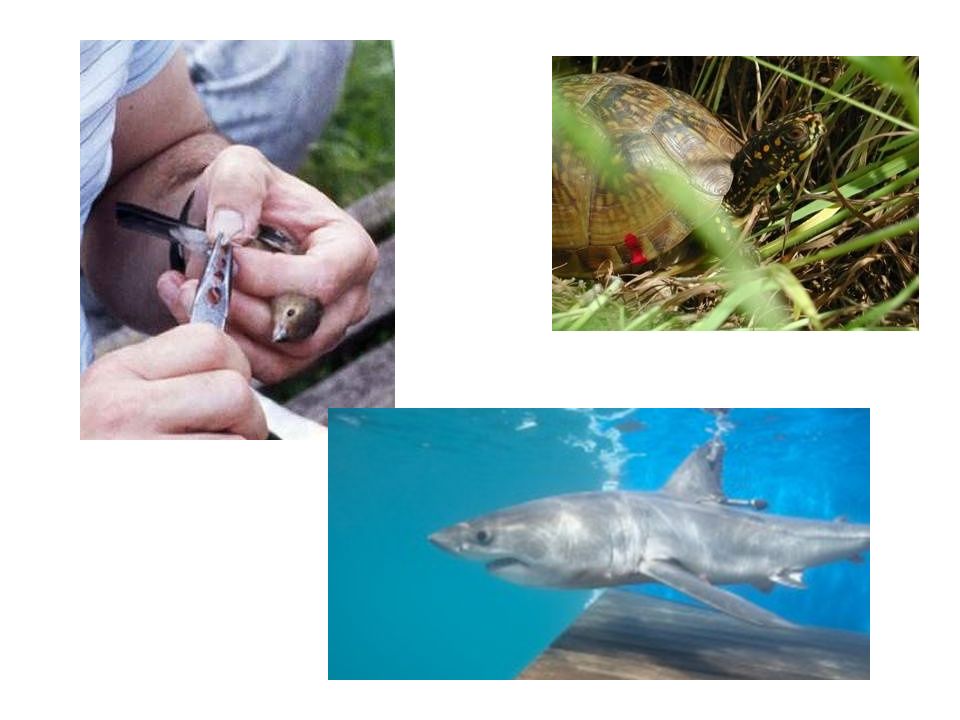
Mark and Recapture Capture animals alive and mark them – Animals are returned unharmed to environment Animals with and without mark are caught – formula is used to estimate population size Population estimate = (total number captured) x (original # with mark) (Total number captured with mark)
 x (original # with mark) (Total number captured with mark)")
31
Mark and Recapture Concerns Capturing could injure the animal or scientist Disturb animal's normal behavior pattern The marks may cause injury to the animals or get lost Marked animals may be more/less attractive to predators Assumes all animals require the same effort to get caught – might catch the weaker or younger animals more Some animals learn to fear the traps and avoid recapture – or become trap-happy and attempt to get caught because there is food

32
Formula for Mark and Recapture Ecologists marked 20 bears in an area. Over 5 years they captured 100 bears. Of those 100 captured 50 had a tag. What is the population of the bears? Population estimate = (total number captured) x (original # with mark) (Total number captured with mark)
 x (original # with mark) (Total number captured with mark).")
33
List 3 factors that might affect the carrying capacity of a population Agenda for Tuesday Oct 25 th 1.Human Populations

34
Human Population Growth

35
Was slow and stable – Environment kept size constant Recent increase in growth – Technology – agriculture, medicine, shelters Developing countries add more than developed countries

36
Human Carrying Capacity Humans have a carrying capacity Technology allows an increase in carrying capacity Concerns about reaching/exceeding carrying capacity – resources being used

37
Human Population Growth Zero population growth – birth rate + immigration rate = death rate + emigration rate Age structure – # of males and females in three age groups Pre-reproductive (0-19), reproductive (20-44), and post –reproductive (45-80+)
, reproductive (20-44), and post –reproductive (45-80+)")
39
List 2 things that allow the human’s carrying capacity to increase. Agenda for Wednesday Oct 26 th 1.Go over HW 2.Go over density dependent/independent 3.Biodiversity

40
Define density independent factor and list 2 examples and explain how they limit a population. Define Density dependent factors and list 2 examples and explain how they limit a population.

41
Describe what is happening to the population in the graph below. Agenda for Wednesday

Similar presentations


>")


