Download presentation
Presentation is loading. Please wait.

1
Predicting effects of climate change on stream ecosystems in the conterminous United States: results from a pilot study in California Charles P. Hawkins Jiming Jin, David Tarboton, Ryan Hill & John Olson 1

2
USEPA-STAR funder project: Predicting effects of climate change on stream biodiversity in the USA Maximum Annual Air Temperature (1971-2000) (~ 0- 30 C) 2
 (~ C) 2")
3
Annual Mean Precipitation (1971-2000) (<10 – 400 cm / year) 3
 (<10 – 400 cm / year) 3")
4
How will climate change affect stream invertebrate faunas at both reference and previously stressed sites? Will effects of climate change confound biological assessments? Are certain taxa and types of streams more vulnerable to climate change than others? 4

5
5 National Wadeable Stream Assessment Reference Sites

6
Statistical downscaler GCM then RCM DEM, land cover, Soils, geology Climate Change Greenhouse gas forcing 6 hr 20 km resolution Physically based hydrologic model Statistical streamflow regime model USGS Streamflow Physically based change predictions Watershed attributes Aggregate climate variables Model Parameters Detailed weather Macroinvertebrate composition and assemblage structure Reference streamflow Streamflow classification PCA factors Classes Temperature

7
7 WSA Probabilistic Sites

8
V California as a pilot study 1999 variation in mean annual temperature ( o C) (PRISM data) 8
 (PRISM data) 8")
9
9

10
Probabilities of detection (PD): A foundation for estimating biodiversity and calculating biological indices PD are associated with both abundance and richness: – MMIs: Abundance-based metrics Richness metrics – O/E = ∑O/∑PD 10
: A foundation for estimating biodiversity and calculating biological indices PD are associated with both abundance and richness: – MMIs: Abundance-based metrics Richness metrics – O/E = ∑O/∑PD 10")
11
Hypothetical Changes in PD & Taxa Richness Taxon19991900204020902090-1999 A0.870.850.410.22-0.65 B0.010.030.200.36+0.35 C0.920.880.710.58-0.34 D0.740.750.770.740.00 E0.160.200.050.00-0.16 etc.0.600.640.500.31-0.29 NTaxa3.303.352.642.21-1.09 11

12
RIVPACS Model NCAR CCSM A2 (150 km) PRISM Temperature Precipitation (4 km) Downscaled Climate Predictions 1999-2008 1900-1909 2040-2049 2090-2999 1999-2009 Stream Benthic Invertebrate Data Predicted Taxon- Specific PD Catchment Data 12
 PRISM Temperature Precipitation (4 km) Downscaled Climate Predictions Stream Benthic Invertebrate Data Predicted Taxon- Specific PD Catchment Data 12")
13
Estimating O/E 1999 calibration: ∑O/∑pd 1900, 2040, 2090 predictions: ∑pd (year) / ∑pd (1999) 13
 / ∑pd (1999) 13")
14
14

15
12 site classes The California reference sites: 340 taxa. 327 sites classified into 14 groups for model building. 15 Group 13

16
5 Predictors Group 13: warmest driest highest TDS 16 ● ● ● ● ●

17
Predicted changes in climate-sensitive predictors 17

18
1900 backcast1999 modeled2090 forecast A2 Climate Change Scenario (CCSM 250 -> 4 km empirically downscaled predictions) Mean Annual Temperature ( o C)
 Mean Annual Temperature ( o C)")
19
1900 backcast1999 modeled2090 forecast A2 Climate Change Scenario (CCSM 250 -> 4 km empirically downscaled predictions) Mean Monthly Precipitation (mm)
 Mean Monthly Precipitation (mm)")
20
2090-1999 comparisons 20

21
Changes in climate-sensitive predictors (2090-1999) across 327 reference sites Statistic Precipitation (mm) Temp (C) Cond (μS/cm) Mean-262.448 Minimum-611.4-30 Maximum+54.6180 21
 across 327 reference sites Statistic Precipitation (mm) Temp (C) Cond (μS/cm) Mean Minimum Maximum")
22
22

23
Individual taxa Average changes in PD – 172 decreasers (8 ≤ 0.1) – 168 increasers (1 ≥ 0.1) Many predicted local extinctions (rare taxa). No predicted regional extinctions. 23

24
-0.16 -0.14 -0.13 +0.10 +0.08 +0.07 Most Sensitive Taxa (mean ∆PD) 24
 24")
25
What is the consequence for reference site taxa richness and O/E? 25

26
~10% loss in mean site richness by 2090 No loss in regional richness 26

27
Change in O/E (2090-1999) Mean ∆O/E = -0.12 40% 12% 27
 Mean ∆O/E = % 12% 27")
28
28

29
Predictors of Site Vulnerability (Δ O/E) (PRE = 0.24) -0.12 (n=327) -0.16 (260) -0.04 (67) -0.06 (110) -0.23 (150) 0.18 (11) -0.26 (139) MAP < 58 mm MAAT > 9.8 MAAT < 16.5 Artifact associated with end-member predictions? Driest Warmest Coldest 29

30
How realistic are these predictions? Climate predictions? – Accuracy of CCSM? – Accuracy of downscaling? Biota predictions? – General accuracy of RIVPACS model? – End-member problem? 30

31
Related Issues and Work Downscaling – some caveats – Empirical versus dynamic – Yearly/seasonally versus regime Invertebrate-environment relationships – Stream temperature models – Flow models 31

32
A2 2090 Temperature ( o C) CCSM Original (150 km)CCSM Downscaled (4km)
 CCSM Original (150 km)CCSM Downscaled (4km)")
33
Stream Temperature Modeling Pilot Study N = 455 50 validation

34
Modeling (MLR) XTEMP ModelPredictorsR2R2 RMSE Geographyelevation latitude WS area longitude 0.751.3 o Climate-WSelevation mean air temperature latitude WS area # of frost-free days others 0.861.0 o
 XTEMP ModelPredictorsR2R2 RMSE Geographyelevation latitude WS area longitude o Climate-WSelevation mean air temperature latitude WS area # of frost-free days others o")
35
Geography model Climate-WS model XTEMP Residuals SD = 1.5 SD = 1.0

36
VariablePredictorsR2R2 RMSE XTEMP elevation mean air temperature latitude # of frost-free days WS area 0.861.0 o SUMMER maximum air temperature # of frost-free days latitude soil bulk density WS area 0.732.2 o WINTER mean air temperature minimum air temperature soil permeability % granitic geology depth to water table 0.751.7 o

37
Do modeled stream temperatures improve predictions of biota?

38
n = 132 7 classes of CO reference sites

39
How well did 2 RIVPACS-type models predict invertebrate composition in Colorado reference streams? ModelPredictors BothDay of year Long-term precipitation Previous year precipitation Local topographic relief GeographyLatitude Elevation WS area Predicted Temperature SUMMER WINTER

40
% correct by model GroupsSurrogates3 TempsChange 147 0 27382+9 373 0 46480+16 5833+25 63360+27 753 0 Total54639

41
41 Expanded stream temperature modeling EPA-STAR grant & USGS/NAWQA collaboration

42
Stream temperature candidate reference sites

43
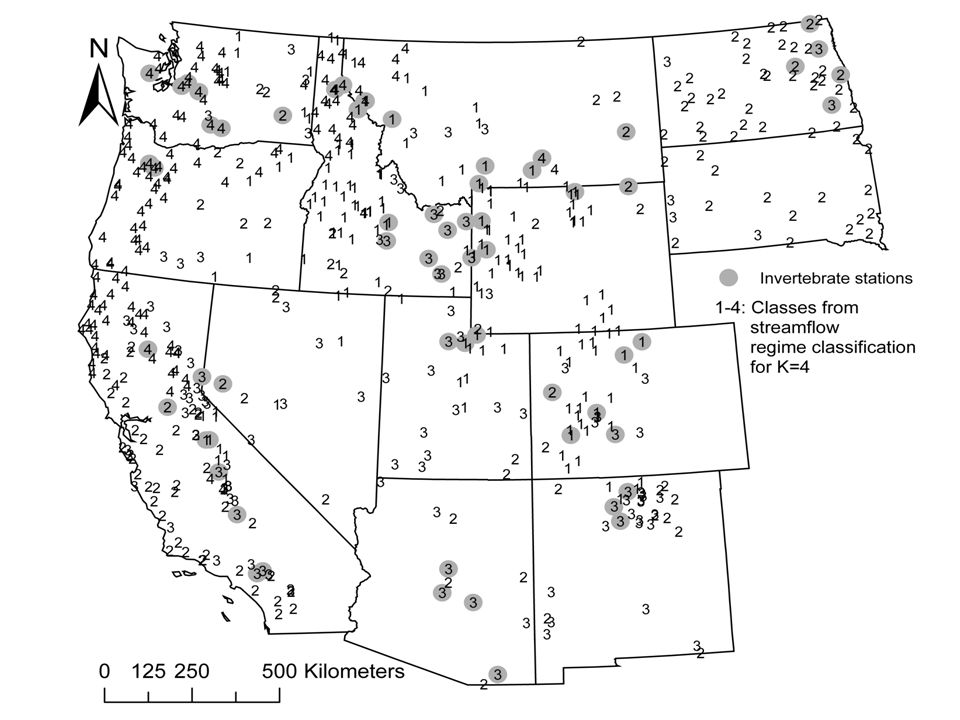
43 Stream flow modeling by David Tarboton and students

47
Modeled stream flows and temperatures improve predictions of stream invertebrates ModelO/E 10 th % Null0.58 Flow (7 factors)0.73 Temperature (3 variables)0.67 Flow + Temperature0.80 47
0.73 Temperature (3 variables)0.67 Flow + Temperature")
48
Flow and temperature modeling sites

Similar presentations


 fusion into DEM raster (burning in) - Sink removal - Flow direction - Flow.>")


 Siraj Ul Islam, Nadia Rehman.>")


