Download presentation
Presentation is loading. Please wait.

1
SWK 707 Research for Social Work Practice Nechama Sammet Moring CLASS 9

2
Plan for tonight 6:00-6:10 logistics, check in 6:10-7:00 odds ratios, chi square, regression 7:00-7:30 problem identification, interventions to address problems 7:30-7:40 break, post it gallery walk 7:40-8:00 evaluating whether the intervention works, post it gallery walk 8:00-8:50 literature review lecture and activity 8:50 evaluations, I promise

3
4 basic types of statistical tests: Mean, standard deviation Median, Mode Percentage, frequency Description Pearson’s correlation Correlation Student’s t tests Chi-square tests ANOVA Odds ratios Comparison OLS regression Logit regression Prediction

4
Review Descriptive statistics describe patterns in your data; does NOT show relationships. Usually univariate, identifies what’s typical and outliers Kinds of description: frequency, central tendency (mean, median, mode); variance (dispersion); standard deviation Correlation-measures relationship between 2 continuous variables. Can be none, positive, negative, curvilinear
; variance (dispersion); standard deviation Correlation-measures relationship between 2 continuous variables. Can be none, positive, negative, curvilinear.")
5
More review Statistical significance: p=value, confidence intervals T-tests: measure whether there is statistically significant differences in the MEAN of 2 groups; gives you a p-value and a t-statistic. Higher t-statistics = more difference between means ANOVA-like t-tests but compare the means of multiple groups. Gives you a p- value and an f-statistic.

6
Descriptive statistics review: Why? Need to present data aggregate rather than describing each data point to make sense of large amounts of data Find and describe patterns Shows what is typical and what outliers exist-extent and range Does not speak to relationships between variables, just describes individual variable, rather than their relationship to each other Demographic information

7
Review of kinds of variables Dichotomous-one of 2 options (i.e. yes/no) Nominal-mutually exclusive categories (zombie, human, sheep, elephant) Ordinal-mutually exclusive categories that go in order (1 st, 2 nd, 3 rd ) Continuous (interval)-rank ordered, mutually exclusive and there is the same amount of difference between each variable, like height, 5, 5’1, 5’2 etc) Ratio-continuous but with a fixed 0 (number of kids, 0-19)
 Nominal-mutually exclusive categories (zombie, human, sheep, elephant) Ordinal-mutually exclusive categories that go in order (1 st, 2 nd, 3 rd ) Continuous (interval)-rank ordered, mutually exclusive and there is the same amount of difference between each variable, like height, 5, 5’1, 5’2 etc) Ratio-continuous but with a fixed 0 (number of kids, 0-19).")
8
Kinds of variables examples Dichotomous-you are either under 50 or 50 and above (so you either do or do not meet the recommended age for routine mammogram screening) Nominal-genders-male, female, non-binary, gender-queer, agender etc (so use mode because you can’t have an “average” gender and there is no scale for ranking gender) Ordinal-age groups who receive services-early intervention aged children, elementary aged children, adolescents, adults, elderly. Groups go in order, but the interval between groups isn’t the same Continuous-grades in K-12; there is the same difference (interval) between 1 st and 2 nd grade and between 2 nd and 3rd
 between 1 st and 2 nd grade and between 2 nd and 3rd.")
9
frequency How often a characteristic or variable occurs Can compare frequency across different groups

10
Measures of central tendency Mean=mathematical average (add up all scores, divide by number of scores) median = the score in the exact middle of all the scores, the midpoint Mode=the score that occurs the most; often used with nominal variables (i.e. more Catholics than Protestants in my sample, because you can’t really come up with the average religion) Outlier-something out in left field that can really skew the mean (but not so much the median or the mode)
 Outlier-something out in left field that can really skew the mean (but not so much the median or the mode).")
11
Median and mode Sometimes the mean is skewed If so, using one of these makes more sense: Median the value below which 50% of the scores fall, or the middle score Median age at which people first had a counseling experience Mode the most frequent score Most common age at which people first had a counseling experience

12
Ways to measure dispersion of data Range (from what to what), the overall spread of data from lowest to highest Variance- a statistical measure (we won’t be doing the math) that gives a “score” based on how far apart the data is from each other. Standard deviation-math calculated more precise way of finding out the “average” difference from the mean score, calculated with the square root of the variance

13
Standard deviation: Most commonly used measure of dispersion around a mean how “spread out” are the values? Always reported together – otherwise considered to be biased Can’t be done with nominal variables

14
Standard deviation in a normally distributed sample Dark blue < 1 “standard deviation” from the mean Accounts for 68.3%

15
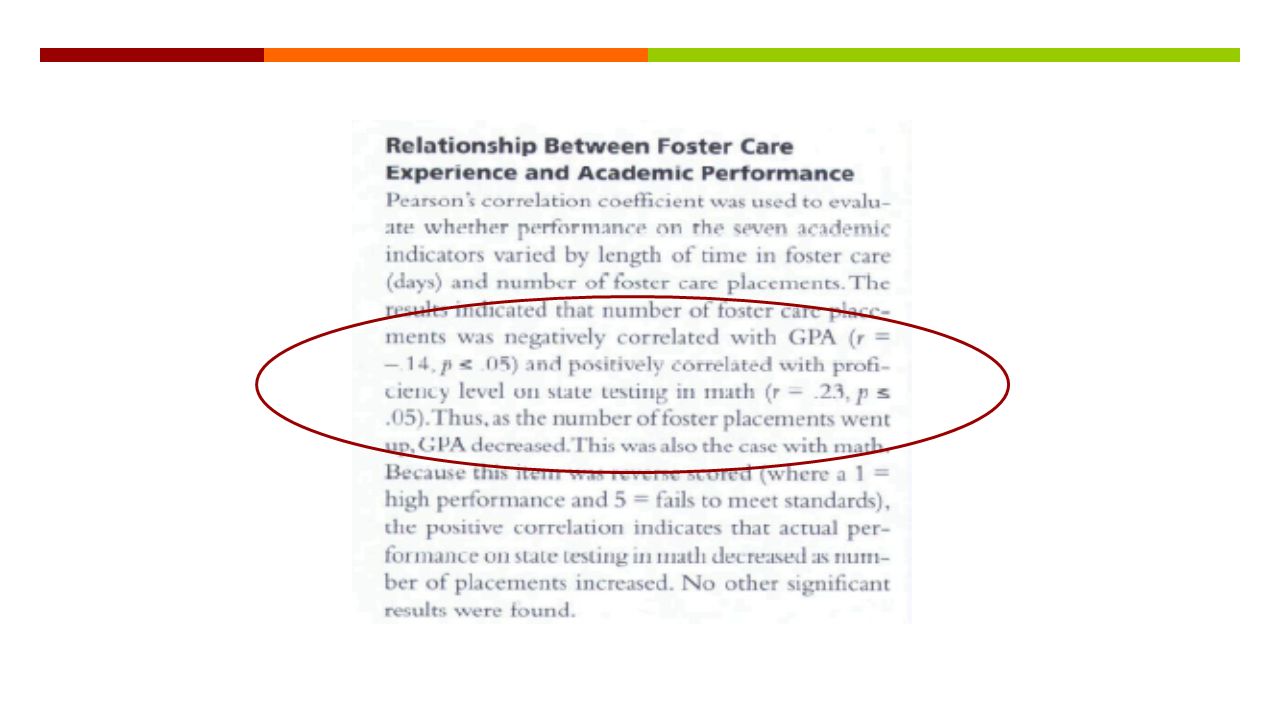
Rodriquez & Murphy

16
4 basic types of statistical tests: Mean, standard deviation Median, Mode Percentage, frequency Description Pearson’s correlation Correlation Student’s t tests Chi-square tests ANOVA Odds ratios Comparison OLS regression Logit regression Prediction

17
Measures of association: Correlation Ways to measure the correlation (relationship) between 2 variables (i.e untreated chronic disease and mental illness) How change in the dependent variable is related to change in the independent variable (so if I increase the independent variable by X%, how much will the dependent variable change?) Measures association/relationship between 2 continuous variables
 between 2 variables (i.e untreated chronic disease and mental illness) How change in the dependent variable is related to change in the independent variable (so if I increase the independent variable by X%, how much will the dependent variable change ) Measures association/relationship between 2 continuous variables")
18
4 kinds of correlation No correlation-there is no relationship (i.e your program is ineffective) Positive correlation-the dependent variable increases when the independent variable increases (the older I get (I), the more gray hair I get(D)) Negative correlation-the dependent variable decreases when the independent variable increases (the older I get (I), the less I can remember (D). Also called inverse correlation Curvilinear correlation-the dependent variable curves in response to changes in the independent variable-there is a cut off point (my comfort in New England starts off low in January, increases through June and gets worse in August, if temp is the dependent variable

19
Correlation tests Number between -1 and 1 0= no correlation Arrived at through math Negative numbers = a negative correlation, which can be high (-0.9) or low (-0.1) Called the R score Numerical way of saying how related 2 things are, mathematically
 or low (-0.1) Called the R score Numerical way of saying how related 2 things are, mathematically")
20
P values Mathematical way of saying how probable it was that the relationship is statistically significant (not due to chance alone) 0.05 is good. If p = 0.05 or less, the results are statistically significant In other words, if p = more than 0.05, your results could just be a fluke, because life is full of uncertainty and coincidence.

21
Confidence intervals A range that tells us how confident we can be that our sample is representative of the population we sampled from Should be 95% or higher Always expressed as a range, i.e. (95% CI 12, 16) Bigger sample sizes make the numbers within the 95% confidence interval smaller (i.e. 12-16 vs 2-20)
 Bigger sample sizes make the numbers within the 95% confidence interval smaller (i.e vs 2-20).")
23
4 basic types of statistical tests: Mean, standard deviation Median, Mode Percentage, frequency Description Pearson’s correlation Correlation Student’s t tests Chi-square tests ANOVA Odds ratios Comparison OLS regression Logit regression Prediction

24
Students’ t-test: Why use it? Assesses whether the means of 2 groups are statistically different from each other Appropriate whenever you want to compare the means of 2 groups After doing some math, you get a t-score and significance score (p value). The t-score tells you how different the mean of each group is from the other group. Higher t- scores are higher differences. The significance score is how likely this is to be due to chance alone; should be over 0.05
. The t-score tells you how different the mean of each group is from the other group. Higher t- scores are higher differences. The significance score is how likely this is to be due to chance alone; should be over")
25
“Student’s t” test: Choices Independent samples Groups are independent of each other Individuals randomly assigned into two groups Paired samples Groups are paired Each group member has a unique relationship with a particular member of the other sample

26
ANOVA tests (analysis of variance) AKA: Fisher’s test of variance Fisher’s ANOVA Fisher’s analysis of variance One-way ANOVA Like t-tests, but they compare 2 or more groups (usually used with 3 or more) Compare groups on a continuous variable Instead of a t-statistic, you get an f- statistic and a significance score (p- value). F score should be higher than 2 if the means are difference, significance score should be over 0.05

27
Odds ratios: A way of comparing whether the probability of a certain event is the same for two groups Remember, probability is NOT a guarantee! Requires two groups Comparison of groups on a nominal variable Intuitive: Easy to interpret Easy for your audience to interpret!

28
Odds ratios: What does it tell you? What are the odds that one group is more likely than another to experience one condition Male vs. Female ex-offenders on post-incarceration employment retention for a year or more (Y/N)? People with and without disabilities: Who is more likely to access substance abuse treatment (Y/N)?
. People with and without disabilities: Who is more likely to access substance abuse treatment (Y/N) .")
29
Odds ratios: What you are looking for OR = 1 Condition equally likely in both groups OR > 1 (more than) Looks like this: OR=2.34* Condition is more likely in the first group OR < 1 (less than) Looks like this: OR=0.34* Condition is less likely in the first group
 Looks like this: OR=2.34* Condition is more likely in the first group OR < 1 (less than) Looks like this: OR=0.34* Condition is less likely in the first group")
30
Odds ratios: How to interpret them OR=1.5***1.5 times more likely… OR=12.5***Almost 13 times more likely… OR=0.50***Fifty percent less likely… OR=O.89***11 percent less likely…

31
Use of compliance training among children with autism and later PTSD Your white bowl is for kids with autism who receive compliance training. Put 6 sour patch kids/gummy bears into your white bowl, including 3 green ones Your blue bowl is for kids with autism who do NOT receive compliance training. Put 1 green and 5 other sour patch kids/gummy bears in your blue bowl Green sour patch kids represent later PTSD. As you can see, the odds of PTSD are higher in your white bowl Important to note that being in the white bowl does not guarantee you will get PTSD. It just means that you have a higher likelihood

32
Non-parametric statistics Don’t meet the rules (parameters) to be parametric statistics Still inferential Smaller sample size Chi square
 to be parametric statistics Still inferential Smaller sample size Chi square")
33
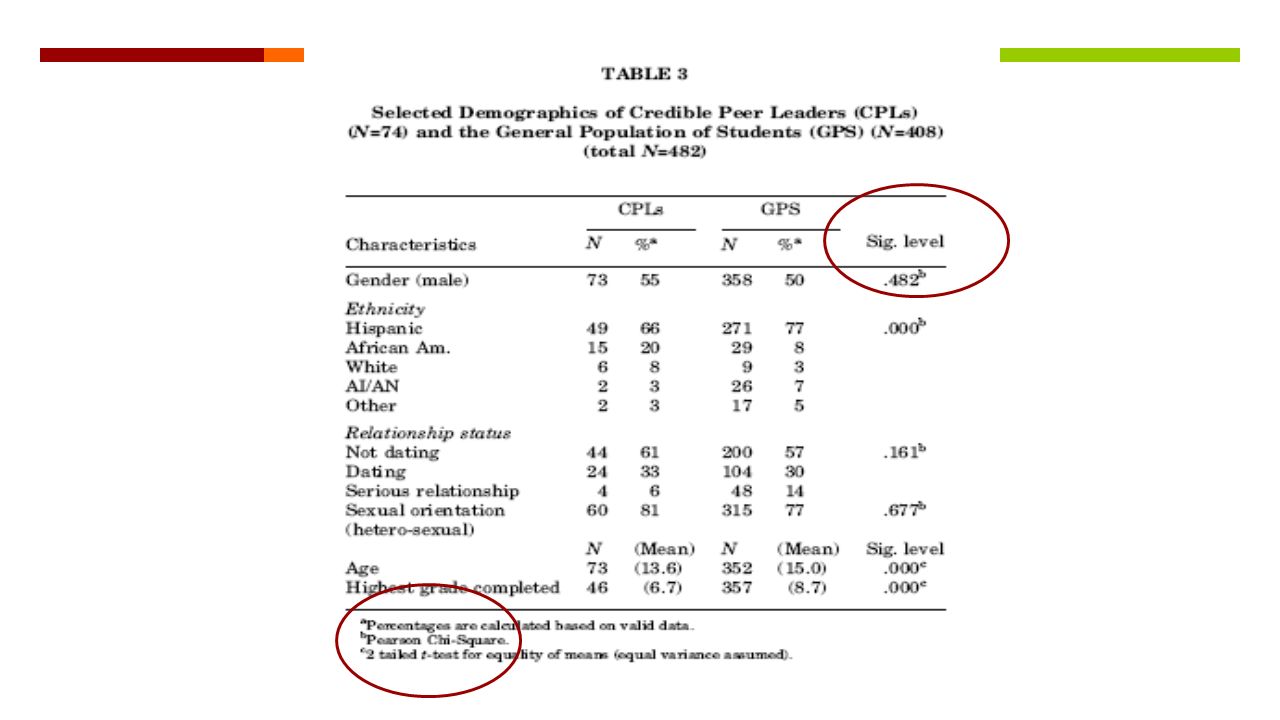
Χ 2 or Chi-Square Tests AKA: Chi-square goodness-of-fit test, commonly referred to as the chi-square test Pearson’s chi-square test Yates’ chi-square test, also known as Yates' correction for continuity Mantel-Haenszel chi-square test Linear-by-linear association chi-square test

34
Χ 2 or Chi-Square Tests Compare 2 or more groups (2 is easiest) Commonly used with small sample sizes Compare groups on a nominal variable only Way to tell if there is a difference between groups of observations, and is the difference more than would be expected due to chance alone? Generates a significance level. Higher is better

35
Shared decision making example We know that in general, people with lived experience of mental health conditions have a 30% chance of experiencing involuntary hospitalization during their life time. In other words, we would “expect” 3 out of 10 people with lived experience to be involuntarily hospitalized Your blue bowl is people who receive “standard” care. Put 10 sour patch kids, including 3 orange ones in this bowl. Orange = involuntary hospitalization Your white bowl represents people who receive support using a shared decision making model. Put 10 SPKs including 1 orange in this bowl We would expect 3 orange SPKs in each bowl based on the general statistic. However, we only observed 1 orange SPK in the shared decision making bowl The ratio of “expected” to “observed” = the significance level

37
A lot of different factors go into every toddler-created sink jam

38
The complex sink jam

39
Regression analysis is a way of taking everything but your toothbrush out of the sink to examine it’s impact independently

40
Regression Prediction vs comparison: what will happen if I throw in a toothbrush? We want to know what is likely to happen when variables interact Useful for understanding complex problems Finds the “best fit” for a linear relationship between variables

41
Regression: Confounders Confounder= any variable that impacts both the independent and dependent variable Regression analysis lets us quantify the relationship between an independent variable and a dependent variable (outcome) while controlling for other, often confounding factors In other words, estimate the effect of one variable without “noise” from other, potentially confounding variable
 while controlling for other, often confounding factors In other words, estimate the effect of one variable without noise from other, potentially confounding variable")
42
Regression basics Usually done with software You still need to pay attention to bias (validity) and generalizability Sample must be representative of the population Disproves the null hypothesis (exercise and cardiovascular health have no relationship) by removing other impacts on cardio health Consider cause and effect for each variable (the playing squash example from the reading) and direction to avoid bias
 and generalizability Sample must be representative of the population Disproves the null hypothesis (exercise and cardiovascular health have no relationship) by removing other impacts on cardio health Consider cause and effect for each variable (the playing squash example from the reading) and direction to avoid bias")
43
You start with a scatter plot…. Distance between each point on the scatter plot and the line of best fit is called a residual Line of best fit

44
Some math happens Higher residual = less good line of best fit Ordinary least squares (OLS) regression calculates the squared distance of each residual and adds all this together Through the magic of math, outliers get more weight You get a regression line (the line of best fit), with an equation to describe how steep the line is. The steepness (slope) of the line and how close the residuals are describe the strength of the relationship The line is saying that for every increase of 1 unit in the independent variable, the dependent variable increases by the slope of the line
 of the line and how close the residuals are describe the strength of the relationship The line is saying that for every increase of 1 unit in the independent variable, the dependent variable increases by the slope of the line.")
45
More math The regression equation is y = a + bx Y = the dependent variable A = the y intercept of the line (where the y axis is naturally when the x axis is 0). A is a real number that’s sometimes called the constant, because it doesn’t change B = the slope of the line (how steeply it rises). Sometimes called the regression coefficient because it estimates the relationship between the independent and dependent variables X = the independent variable This formula lets us predict what impact changing the independent variable will have on the dependent variable. So in other words, if I raised X by 2 units, what change would we expect to see in Y, if we know that the line moves at B slope. This basically says that for every increase of 1 unit in X, Y will increase by B units B can be positive or negative Please don’t stress over this formula. You will never need to use it in this class
. Sometimes called the regression coefficient because it estimates the relationship between the independent and dependent variables X = the independent variable This formula lets us predict what impact changing the independent variable will have on the dependent variable. So in other words, if I raised X by 2 units, what change would we expect to see in Y, if we know that the line moves at B slope. This basically says that for every increase of 1 unit in X, Y will increase by B units B can be positive or negative Please don’t stress over this formula. You will never need to use it in this class.")
46
In summary: B is the amount of difference you can expect to see in the dependent variable for every increase of 1 unit in the independent variable. B is also called the regression coefficient, or just the coefficient Using math, we also get a R 2, which is the amount of difference explained by this particular independent variable. The R 2 is always a number between 0 and 1. Higher numbers mean that this variable controls MORE of the difference. 1 minus the R 2 is the amount of difference NOT explained by this variable

47
Statistical significance We calculate something called the standard error, which is basically a standard deviation for regression, using math. Smaller standard error is usually associated with larger, more representative samples Using math again, we calculate a confidence interval. 95% CI = we are 95% confident that if our coefficient falls between point A and point B, it is not do to chance alone. And finally, we also get a p value, which should be less than 0.05

48
So, now we want to test the impact of multiple variables That means that all other factors need to stay constant while just one variable is adjusted In other words, height explains some of your weight, but not all of it, so let’s keep everyone’s height the same and add in other factors to see how much they influence your overall weight: doritos, exercise, dog ownership, age, income, gender (and the textbook is wrong, gender is NOT a binary variable) You get an R 2 for EACH factor you throw into the model, letting you know how much EACH variable explains the difference. You also get a p value for each, letting you know how statistically significant the result is

49
Quick math notes If your variable is truly binary (dichotomous), you use a similar equation/process called logistic regression Sometimes variables are “dichotomized” (made binary) so you can use logistic regression (i.e. white vs. non-white; experienced 1-3 vs. more than 3 instances of involuntary hospitalization etc) Logistic regression gives you a log odds, which is like an odds ratio Everything is less effective with smaller samples. Lower degrees of freedom (d.f.) = smaller sample size = less significant Moving on…
 Logistic regression gives you a log odds, which is like an odds ratio Everything is less effective with smaller samples. Lower degrees of freedom (d.f.) = smaller sample size = less significant Moving on….")
50
Example: life expectancy and serious mental illness We have good evidence that people with SMI have much higher rates of preventable negative health outcomes and live an average of 25 years less than their peers without SMI Factors that might be involved: lack of access to health care; lack of social supports isolation, lack of practical supports for getting health care; discrimination in care; social stigma unemployment financial inequity and can’t afford needed medical treatment; unstable housing; involuntary hospitalization; medication side effects; toxic stress Other factors that might be important: race (and experience of racism or discrimination); vegetarian diet; pet ownership; gender; violence victimization
; vegetarian diet; pet ownership; gender; violence victimization")
51
Now let’s predict how responsible each of these factors are for shortened life expectancy Each candy represents a factor you are testing Throw all your candy into the pot, stacked up For every one unit of candy (the factor), how much does the chance of dying early increase? In other words, how much does your line change when you add in the candy? How statistically significant is this increase? What % of the different life expectancy does each factor explain? Note that the impacts are different for each factor-candies are different shapes and sizes. Some factors are more important than others. Some don’t change the formula at all

52
Inter-related factors Changing the amount of peer support a person gets will change their life expectancy by.03, all on its own BUT! Peer support reduces isolation, which in turn reduces comorbid depression, so the coefficients for depression and isolation also change. So do the coefficients for increased self-determination and self-efficacy Examining these additional changes help un-tangle relationships among factors and demonstrate causality

54
Assignment 3

55
Assumptions Your agency just got a grant to serve your specific population of interest Based on your clinical experience and knowledge of the population, they have asked you to recommend a SPECIFIC intervention (i.e. wrap around services, peer support, foster care, guardianship etc) In order for the grant to get reviewed, the funder is requiring a program evaluation of the intervention (NOT the agency as a whole). You will describe how the intervention should be evaluated in part 4
 In order for the grant to get reviewed, the funder is requiring a program evaluation of the intervention (NOT the agency as a whole). You will describe how the intervention should be evaluated in part 4.")
56
Identifying a problem, research question, intervention, evaluation research design Social problem Has real, negative impacts on individuals and society Is action-able Is contexualized Intervention Specifically designed to address the social problem or lessen its negative impacts in your population Tailored to your population and feasible evaluation Concretely measure if the intervention is working Does the intervention effectively address or lessen impacts of the social problem?

57
Midwife example: Prenatal vitamins Theorized to improve outcomes, like low birth weight but no real evidence for this Recorded on birth certificate Often used as a proxy for access to care, emotional investment in pregnancy Can make people feel nauseous I want my clients to take them because my boss wants me to encourage my clients to take them and is pissed when I check no on the birth certificate NOT TAKING THEM IS NOT A SOCIAL PROBLEM. HOWEVER, LACK OF ACCESS TO ADEQUATE NUTRITION FOR PREGNANT PEOPLE IS A SOCIAL PROBLEM-WHY?

58
Things that are not social problems Disability (but ableism is a social problem. Lack of equitable job opportunities and resultant poverty among people with disabilities is a social problem) Non-compliance (what you want a person or group to do may not be what they themselves want to do; from their perspective, not complying is potentially supportive, life-saving, preferred etc) Personal inconvenience or individual goals, such as me personally losing some weight, cuz I don’t want diabetes (but lack of access to veggies in my neighborhood is a social problem, because it means that people in my zip code are collectively less healthy than people in Newton, and inequity is always a social problem) Lack of your intervention your intervention is great, but must be focused on reducing a social problem. Not having it can’t be the social problem People. People are never social problems. The marginalization that people experience based on their identity is a social problem. So people being transgender or Black are not social problems, but the extremely high rate of violence against Black trans people is a social problem. Medical issues/problems. No one likes cancer, but cancer is a medical problem. Like disability, biomedical realities are not SOCIAL problems, though they may cause suffering (i.e. cancer)
 Non-compliance (what you want a person or group to do may not be what they themselves want to do; from their perspective, not complying is potentially supportive, life-saving, preferred etc) Personal inconvenience or individual goals, such as me personally losing some weight, cuz I don’t want diabetes (but lack of access to veggies in my neighborhood is a social problem, because it means that people in my zip code are collectively less healthy than people in Newton, and inequity is always a social problem) Lack of your intervention your intervention is great, but must be focused on reducing a social problem. Not having it can’t be the social problem People. People are never social problems. The marginalization that people experience based on their identity is a social problem. So people being transgender or Black are not social problems, but the extremely high rate of violence against Black trans people is a social problem. Medical issues/problems. No one likes cancer, but cancer is a medical problem. Like disability, biomedical realities are not SOCIAL problems, though they may cause suffering (i.e. cancer).")
59
In other words, social problems are: Inequitable in some way-people are not being treated the same Things/conditions that attempt to limit human dignity, autonomy and human rights Replicate larger systems of oppression (sexism/racism/ableism is real in the world, and in our classrooms) Often about access or systems Have very real consequences that negatively impact individuals and/or groups Are contexualized and avoid generalization (person in the environment) For this assignment, are somewhat actionable (i.e. you are not gonna cure cancer, but you can reduce feelings of isolation among cancer survivors)
.")
60
Examples Prostate cancer screening (public health). People not getting screened as recommended by the ACS by itself isn’t a social problem-no one likes getting their prostate checked. However, men of color are 4X more likely than their white counterparts to not get screened, and therefore their cancers are found later and are deadlier. This inequity is a social problem because early preventable death has huge social impacts. Intellectual and developmental disability. Has existed throughout time. Disability is a normal variation of the human condition. However, adults with intellectual disabilities face social exclusion, isolation, poverty, unemployment and preventable negative health outcomes at much higher rates than their non-disabled peers. Children with autism are more often bullied in school and report higher rates of depression Children with behavioral health problems. See above; normal variation of the human experience. Parents of children with behavioral health problems face stigma and report less support and more parenting stress than their counterparts without behavioral health problems. Parenting stress is associated with child abuse. This disparity in child abuse rates is a social problem because abuse has long lasting impacts on families and communities. Untreated, kids are higher risk than their peers for being incarcerated, which impacts families and communities and is preventable. Non-compliance with treatment plans. What is the goal of the treatment plan? (i.e. prevent involuntary hospitalization, harm to the person or society)-in this case the consequences of not accessing treatment is the social problem. Does the person want to treatment? Do they have a choice? Removal of choice is a social problem that disproportionally affects some groups.
-in this case the consequences of not accessing treatment is the social problem. Does the person want to treatment. Do they have a choice. Removal of choice is a social problem that disproportionally affects some groups..")
61
The so what test? People of color have less access to cancer screening Children with behavioral health conditions tend to have fewer friends Masshealth does not cover play therapy. Therefore, low income children with autism do not have access to play therapy.

62
Write down your social problem What are the direct harms of the social problem? Does it pass the so-what test? Workshop your social problem with your neighbor When you are both satisfied, write the social problems on a post it

63
Intervention This is your recommendation for how your agency should address the social problem among your population Remember, for this assignment, your agency does NOT yet offer the intervention. So you get to be in charge of how it should be implemented Your intervention should be based on the 3 wheels of evidence based practice Your intervention should have clear, measurable goals that relate directly to the social problem

64
EBPs in social work: integrate these in your intervention 64

65
Interventions should address or lessen the impacts of the social problem. Examples Mobile screening van to increase access to cancer screening in a community of color to reduce the disparity in screening rates. Measured by increase in # of screenings approaching those of a white community and fewer cancer deaths over time In-home play therapy with kids with autism to teach them strategies for making friends and coping with bullying. Measured by increased use of coping strategies, higher # of friends, higher happiness Make sure you have a clear mechanism of action; a path from point A (your intervention) to point B (your goal) and measurable outcomes
 to point B (your goal) and measurable outcomes.")
66
More example of intervention definition and goals, measurement Meditation classes for kids with behavioral health challenges and their parents to provide support. Measured by decreased parental stress, increased reported support and use of positive behavior management techniques by parents, less child abuse over time; and by increased use of coping skills by kids, less incarceration over time Designing an app for people with depression to break up large tasks into steps and provide reminders. Measured by client satisfaction with the app, increased feelings of support, self-efficacy for managing life tasks, despite the biological impacts of depression on motivation, increased skills, decreased job loss over time

67
Your intervention Name of intervention How it addresses the social problem What are the goals of this intervention Workshop this with your neighbor When you are both satisfied, write the intervention and it’s goals on a post-it

68
Still with me?

69
Evaluation How will we know that your intervention is working? How will we know it is meeting its goal? What needs to be happening for the intervention to have a chance of meeting its goals? (this is your process evaluation question) What is the outcome (goal) that you need to see happening? (this is your outcome evaluation question)
 What is the outcome (goal) that you need to see happening. (this is your outcome evaluation question).")
70
Example evaluation questions Meditation classes for kids with behavioral problems and their parents: Process: Do parents and kids feel welcome at the classes? Do they want to be there? Are they making friends and feeling supported? Are the teachers actually teaching the content (fidelity)? Can they teach? Outcome: Are kids using the meditation skills to manage anger? Do they have fewer negative behaviors? Has parental stress levels changed? Over time, is there a reduction in child abuse rates and/or incarceration rates? Cancer screening van: Process: do people know about the van? Do they trust the van? Are van working treating people well? Outcome: How many people are screened in the van? Does van screening increase the overall % of people in the neighborhood who are screened? Does this increase reduce the screening disparity between PoC and white people?
. Can they teach. Outcome: Are kids using the meditation skills to manage anger. Do they have fewer negative behaviors. Has parental stress levels changed. Over time, is there a reduction in child abuse rates and/or incarceration rates. Cancer screening van: Process: do people know about the van. Do they trust the van. Are van working treating people well. Outcome: How many people are screened in the van. Does van screening increase the overall % of people in the neighborhood who are screened. Does this increase reduce the screening disparity between PoC and white people .")
71
Evaluation questions Must relate back to the goals (which in turn relate to the social problem) Write an evaluation question for each goal. How will you know if the goal is being accomplished? Is this a process or outcome evaluation question? Both? Workshop with your neighbor. Write your evaluation questions down on a post-it note when you are satisfied

72
Study design Brainstorm in your groups about HOW to answer your evaluation questions What study design does your question suggest? At home, continue to think through study design, using your worksheet from last week. EMAIL me with questions, for phone appointments

73
Notes on assignment 2 Overall, excellent and you’re in great shape for assignment 3 Take credit for your clinical experience-name yourself as a source! Integrate this experience into your evaluation of studies-you now what you’re doing! Operationalize, operationalize, operationalize! (what does “successful” or “it worked” mean?) Please use page #s Please proofread
 Please use page #s Please proofread.")
74
Selecting studies Not the first 10 you find! You are evaluating YOUR INTERVENTION, not the causes of your social problem. OK to accept some things as givens (i.e. some kids dislike school, for potentially many reasons, but this is not super relevant to a program to improve grades) Bench science vs social science: the chemistry of how prenatal vitamins are absorbed vs answering “do prenatal vitamins reduce low birthweight?” Be outcome focused! Literature reviews and systematic reviews: describe findings but evaluate how the authors selected and evaluated studies-do you agree or disagree with their methods and analysis?
 Bench science vs social science: the chemistry of how prenatal vitamins are absorbed vs answering do prenatal vitamins reduce low birthweight Be outcome focused. Literature reviews and systematic reviews: describe findings but evaluate how the authors selected and evaluated studies-do you agree or disagree with their methods and analysis .")
75
Strengths and limitations Rationale for why the study was done is important but don’t dwell on it. Instead, focus on integrating findings to answer YOUR research question Not agreeing with you is not a limitation-it’s a consideration. Agreeing with you or supporting your desired intervention is also not a strength-it’s a consideration Your task is to evaluate the QUALITY of the evidence, not simply amass it.

76
Mechanism of action and direction of association Which came first? Any confounders? (I didn’t take prenatal vitamin s because I couldn’t afford them (or food) my baby was low birth weight?) Unless the RESEARCH specifically evaluates mechanism of action (how it works) or direction, we just don’t know. Avoid assumption
 my baby was low birth weight ) Unless the RESEARCH specifically evaluates mechanism of action (how it works) or direction, we just don’t know. Avoid assumption.")
77
Literature review Organizing and synthesizing information Don’t go down the rabbit hole Audience: intelligent but uninformed about your topic adult (me)
")
78
The Brilliant Best Friend System For each article, write the MAIN findings/take home messages ONLY on a separate index card as well as the author’s name so you can track it later Once you’ve prepared your index cards, sort them into piles by theme. This is a lot like grounded coding Ideas that are interesting but beyond the scope of your paper go onto a post-it and into your ziplock for later. It’s ok to put index cards into your ziplock, but don’t “disappear” findings that contradict your intervention-these are important to address.

79
Example: Managing disclosures of abuse by research participants with IDD (piles) Higher rates of sexual violence against people with disabilities higher likelihood of enrolling survivors of violence Barriers to reporting abuse Barriers to justice for abuse survivors with IDD (and impact on abuse prevalence) Research as a safe environment for disclosures (or not) Appropriate responses by professionals (not researchers) to disclosures Wildcard but important Ziplock for later: LGBTQ people w/IDD completely absent from literature; impact of unaddressed trauma on “functioning”; representation, visibility and feminism/why this isn’t a feminist issue; historical connection between rape, incest and eugenics movement
 Higher rates of sexual violence against people with disabilities higher likelihood of enrolling survivors of violence Barriers to reporting abuse Barriers to justice for abuse survivors with IDD (and impact on abuse prevalence) Research as a safe environment for disclosures (or not) Appropriate responses by professionals (not researchers) to disclosures Wildcard but important Ziplock for later: LGBTQ people w/IDD completely absent from literature; impact of unaddressed trauma on functioning ; representation, visibility and feminism/why this isn’t a feminist issue; historical connection between rape, incest and eugenics movement")
80
Further sorting Now that all your literature is in piles, approach each pile and do a further sort. Identify main themes within each pile For each pile and each theme, refer back to your assignment 2 to think about the quality of the evidence. Are there a lot of studies that agree/show the same thing? Take advantage of all the work you already did evaluating the quality of the evidence. Write a summary paragraph for each pile. Provide an outline of main findings ACROSS STUDIES and discuss quality of evidence. Using a bias chart (see handout) will help you assess quality of the evidence. For each pile, is any information missing? (these are the gaps you want to identify)
 will help you assess quality of the evidence. For each pile, is any information missing. (these are the gaps you want to identify).")
81
Example: Combining, evaluating, providing selective detail, identifying gaps in each pile Higher rates of sexual violence against people with disabilities higher likelihood of enrolling survivors of violence. COMBINING: There is extensive, high quality evidence showing that people with disabilities experience much higher rates of sexual violence victimization (Swango-Wilson, 2009; McCarthy 2011; McCormack et al, 2006; Jones et al, 2016). SELECTIVE DETAIL: People with intellectual disabilities are even more likely than their counterparts with other kinds of disabilities to experience sexual violence (Horner-Johnson & Drum, 2006). We know that people with ID are consensually participating in research at higher rates than ever before (Ianoco, 2005). GAPS: While common sense suggests that this higher rate of sexual violence victimization means that researchers who enroll people with IDD in their studies are more likely to encounter research participants who have survived sexual violence, this has not yet been studied. Though some preliminary studies suggest that research participants with IDD view participatory action research as an opportunity to reduce sexual violence in their communities (Northrup et al, 2010), we lack understanding of researchers’ role in responding to sexual violence against people with IDD.
. SELECTIVE DETAIL: People with intellectual disabilities are even more likely than their counterparts with other kinds of disabilities to experience sexual violence (Horner-Johnson & Drum, 2006). We know that people with ID are consensually participating in research at higher rates than ever before (Ianoco, 2005). GAPS: While common sense suggests that this higher rate of sexual violence victimization means that researchers who enroll people with IDD in their studies are more likely to encounter research participants who have survived sexual violence, this has not yet been studied. Though some preliminary studies suggest that research participants with IDD view participatory action research as an opportunity to reduce sexual violence in their communities (Northrup et al, 2010), we lack understanding of researchers’ role in responding to sexual violence against people with IDD..")
82
Let’s try it with 2 articles Using assignment 2, work with a peer to identify themes/categories (piles) and put important findings (only) from your first study onto cards Use your ziplocks as needed to discard interesting but less relevant information for later Switch and help your peer put findings from her first study onto cards and identify themes/categories for her piles Sort your cards into piles If you have time, put findings from your second study onto cards and add these findings to your piles Summarize each pile Buy an index card sorter (or some envelopes) and continue your sorting at home
 and put important findings (only) from your first study onto cards Use your ziplocks as needed to discard interesting but less relevant information for later Switch and help your peer put findings from her first study onto cards and identify themes/categories for her piles Sort your cards into piles If you have time, put findings from your second study onto cards and add these findings to your piles Summarize each pile Buy an index card sorter (or some envelopes) and continue your sorting at home")
83
Next week: Highlight on data collection Bring your evaluation questions! We will be designing, doing and evaluating a brief qualitative interview about your evaluation question topic. We will have about 30 minutes for peer review. Bring either your study design outline or your lit review outline Reading: Get started on your CITI training for week 11

Similar presentations
 Oklahoma.>")


: Analysing data.>")


>")


 Lecture 7.>")

