Download presentation
Presentation is loading. Please wait.

1
Slide 1© ECMWF Presentation to NOAA Climate Reanalysis Task Force, 29 April 2015 ERA-20C results and plans Paul Poli from the ERA section: Dick Dee, Hans Hersbach, Paul Berrisford, Adrian Simmons, Rossana Dragani, Shoji Hirahara, Patrick Laloyaux, Carole Peubey, David Tan

2
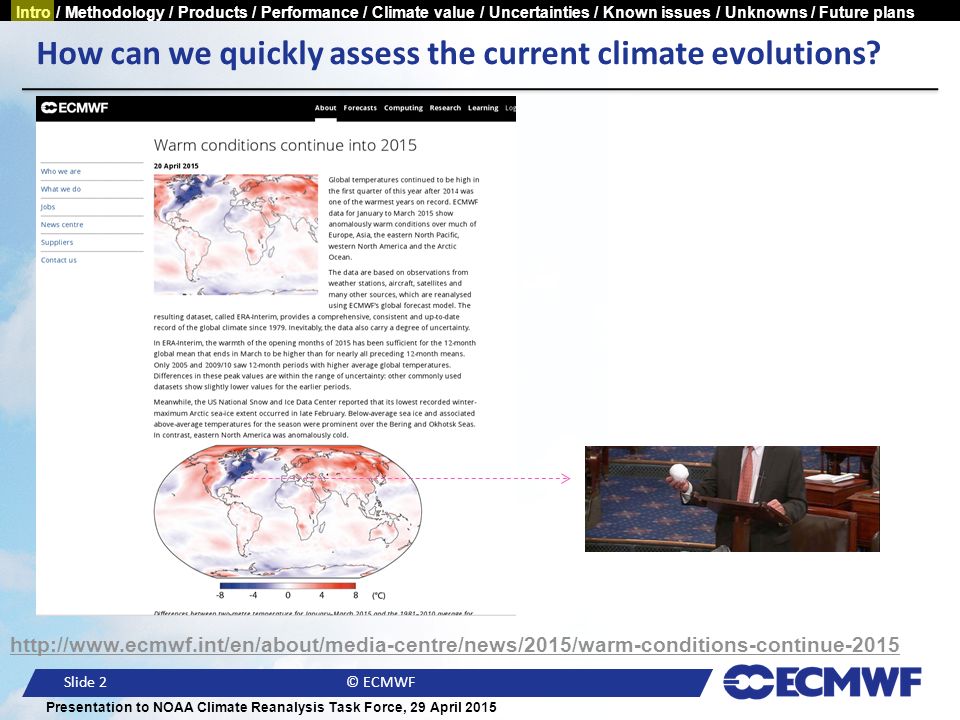
Slide 2© ECMWF Presentation to NOAA Climate Reanalysis Task Force, 29 April 2015 Intro / Methodology / Products / Performance / Climate value / Uncertainties / Known issues / Unknowns / Future plans How can we quickly assess the current climate evolutions? http://www.ecmwf.int/en/about/media-centre/news/2015/warm-conditions-continue-2015
3
Slide 3© ECMWF Presentation to NOAA Climate Reanalysis Task Force, 29 April 2015 Intro / Methodology / Products / Performance / Climate value / Uncertainties / Known issues / Unknowns / Future plans ERA-20C Why ERA-20C? Another step… towards a comprehensive Earth system reanalysis, to be continued in near-real-time (Past) (Future/ Real-time) ERA-Interim ERA-20C is an outcome of the EU FP7-funded ERA-CLIM project, a 3-year project which has now ended. It is the first ECMWF reanalysis of the 20 th century, assimilating only surface observations. It serves as a stepping stone towards: - reanalyzing the other components of the Earth system, such as ocean - reanalyzing also the observations collected so far, including upper-air and satellites It uses an approach very much similar to 20CR (Compo et al., 2011), but using incremental 4DVAR, of course! ERA-15, ERA-40 Upcoming satellites: Copernicus Sentinels, EPS-Second Generation, … to be exploited in NRT for climate monitoring
 (Future/ Real-time) ERA-Interim ERA-20C is an outcome of the EU FP7-funded ERA-CLIM project, a 3-year project which has now ended. It is the first ECMWF reanalysis of the 20 th century, assimilating only surface observations. It serves as a stepping stone towards: - reanalyzing the other components of the Earth system, such as ocean - reanalyzing also the observations collected so far, including upper-air and satellites It uses an approach very much similar to 20CR (Compo et al., 2011), but using incremental 4DVAR, of course. ERA-15, ERA-40 Upcoming satellites: Copernicus Sentinels, EPS-Second Generation, … to be exploited in NRT for climate monitoring.")
4
Slide 4© ECMWF Presentation to NOAA Climate Reanalysis Task Force, 29 April 2015 Intro / Methodology / Products / Performance / Climate value / Uncertainties / Known issues / Unknowns / Future plans Outline of this talk ERA-20C results Methodology employed Products generated Performance observed Climate value of the products Uncertainties in the products Known issues in the products Unknowns in the products Plans for next-generation ERA-20C version x Coupling with the ocean Assimilating more observations throughout the century (upper-air and satellites)
")
5
Slide 5© ECMWF Presentation to NOAA Climate Reanalysis Task Force, 29 April 2015 Intro / Methodology / Products / Performance / Climate value / Uncertainties / Known issues / Unknowns / Future plans ERA-20C system configuration ● Resolution: –Horizontal resolution: T159 (approx. 125 km), as in ERA-40, increments at T95 (approx. 210 km) –Vertical resolution: 91 levels, top at 0.01 hPa –Temporal resolution: 3-hourly output ● Model version IFS CY38R1, with added time-varying forcings: –HadISST2.1.0.0 (sea-surface temperature and ice fraction), greenhouse gases (O 3, CO 2, CH 4, N 2 O, CFC-11, CFC-12, CFC-22, CCL 4 ), solar cycle, and tropospheric and stratospheric aerosols ● Observations sources: –ISPD v3.2.6: using all SP/MSLP observations, except from ICOADS collection –ICOADS v2.5.1: using all observations of SP/MSLP and U10 ● Two productions so far: –a 10-member ensemble:produced in ~200 days in 2013 –a deterministic re-run:produced in ~50 days end 2013-beginning 2014 ● Data assimilation method different from ECMWF NWP operations in 2013/14: –4DVAR with 24-hour window –Ensemble updated its own background error correlations and global variances every 10 days –Deterministic production used constant (current) background error correlations, but global variance was rescaled to the ensemble background error global variance every 100 days –Daily modulation of the background error maps of vorticity by the ensemble spread in vorticity –Digital filtering of increments in vorticity and temperature, to reduce linear model instabilities –Variational bias correction of Ps, with faster convergence in the case of suspected observation time-series breaks (determined based on SNHT homogeneity test applied to 20CR departures)
, as in ERA-40, increments at T95 (approx. 210 km) –Vertical resolution: 91 levels, top at 0.01 hPa –Temporal resolution: 3-hourly output ● Model version IFS CY38R1, with added time-varying forcings: –HadISST (sea-surface temperature and ice fraction), greenhouse gases (O 3, CO 2, CH 4, N 2 O, CFC-11, CFC-12, CFC-22, CCL 4 ), solar cycle, and tropospheric and stratospheric aerosols ● Observations sources: –ISPD v3.2.6: using all SP/MSLP observations, except from ICOADS collection –ICOADS v2.5.1: using all observations of SP/MSLP and U10 ● Two productions so far: –a 10-member ensemble:produced in ~200 days in 2013 –a deterministic re-run:produced in ~50 days end 2013-beginning 2014 ● Data assimilation method different from ECMWF NWP operations in 2013/14: –4DVAR with 24-hour window –Ensemble updated its own background error correlations and global variances every 10 days –Deterministic production used constant (current) background error correlations, but global variance was rescaled to the ensemble background error global variance every 100 days –Daily modulation of the background error maps of vorticity by the ensemble spread in vorticity –Digital filtering of increments in vorticity and temperature, to reduce linear model instabilities –Variational bias correction of Ps, with faster convergence in the case of suspected observation time-series breaks (determined based on SNHT homogeneity test applied to 20CR departures).")
6
Slide 6© ECMWF Presentation to NOAA Climate Reanalysis Task Force, 29 April 2015 Intro / Methodology / Products / Performance / Climate value / Uncertainties / Known issues / Unknowns / Future plans Specifying and estimating uncertainties with a 10-member ensemble of 24-hour 4DVAR data assimilations “Monte-Carlo” equivalent to the estimation problem: Ensemble supposed to contain all sources of uncertainties (nay, it doesn’t…) so that product spread is a measure of product uncertainty 10 members
 so that product spread is a measure of product uncertainty 10 members")
7
Slide 7© ECMWF Presentation to NOAA Climate Reanalysis Task Force, 29 April 2015 Intro / Methodology / Products / Performance / Climate value / Uncertainties / Known issues / Unknowns / Future plans Temperature analysis increments 1979-2010 ERA-Interim ERA-20C ensemble ERA-20C deterministic [K] Fluctuating increments add spurious low-frequency signal to analyses This is the production that we decided to release
![Slide 7© ECMWF Presentation to NOAA Climate Reanalysis Task Force, 29 April 2015 Intro / Methodology / Products / Performance / Climate value / Uncertainties / Known issues / Unknowns / Future plans Temperature analysis increments ERA-Interim ERA-20C ensemble ERA-20C deterministic [K] Fluctuating increments add spurious low-frequency signal to analyses This is the production that we decided to release](http://images.slideplayer.com/41/11170447/slides/slide_7.jpg "Slide 7© ECMWF Presentation to NOAA Climate Reanalysis Task Force, 29 April 2015 Intro / Methodology / Products / Performance / Climate value / Uncertainties / Known issues / Unknowns / Future plans Temperature analysis increments ERA-Interim ERA-20C ensemble ERA-20C deterministic [K] Fluctuating increments add spurious low-frequency signal to analyses This is the production that we decided to release")
8
Slide 8© ECMWF Presentation to NOAA Climate Reanalysis Task Force, 29 April 2015 Intro / Methodology / Products / Performance / Climate value / Uncertainties / Known issues / Unknowns / Future plans ERA-20C Products at http://apps.ecmwf.int/datasets/ 3-hourly and invariant fields (Monthly means available on MARS, soon on the web) Observation feedback (available on MARS, soon on the web), allowing discovery before retrieval (Facility will be further developed in near-future)
 Observation feedback (available on MARS, soon on the web), allowing discovery before retrieval (Facility will be further developed in near-future)")
9
Slide 9© ECMWF Presentation to NOAA Climate Reanalysis Task Force, 29 April 2015 Intro / Methodology / Products / Performance / Climate value / Uncertainties / Known issues / Unknowns / Future plans Looking first at a single case: European Storm of 16 Oct 1987 Best 24-hour forecast is from ERA-20C ensemble ERA-20C deterministic gives a degraded view (though still better than ERA-40)
")
10
Slide 10© ECMWF Presentation to NOAA Climate Reanalysis Task Force, 29 April 2015 Intro / Methodology / Products / Performance / Climate value / Uncertainties / Known issues / Unknowns / Future plans Climate value for the water cycle (I) In spite of a systematic bias (~2 mm too dry), ERA-20C is closer to RSS and HOAPS in terms of inter-annual- variability than ERA-Interim and JRA-55
 In spite of a systematic bias (~2 mm too dry), ERA-20C is closer to RSS and HOAPS in terms of inter-annual- variability than ERA-Interim and JRA-55")
11
Slide 11© ECMWF Presentation to NOAA Climate Reanalysis Task Force, 29 April 2015 Intro / Methodology / Products / Performance / Climate value / Uncertainties / Known issues / Unknowns / Future plans Climate value for the water cycle (II) A. Simmons

12
Slide 12© ECMWF Presentation to NOAA Climate Reanalysis Task Force, 29 April 2015 Intro / Methodology / Products / Performance / Climate value / Uncertainties / Known issues / Unknowns / Future plans Uncertainties generated by the ERA-20C ensemble: Ensemble spreads. Example here with 2-metre temperature Reduction in ensemble spread in ERA-20C is stronger than in ERA-20CM Increase in intra-month variability in ERA-20C is NOT observed in ERA-20CM The factor 50x over the century in number of obs surely explains this. But why does the reduction in spread match the increase in variability? -Is this an unwanted feature of the ensemble method that we used? ERA-20CM: model integration driven by forcings, without any assimilation (Hersbach et al., 2015 doi: 10.1002/qj.2528)
.")
13
Slide 13© ECMWF Presentation to NOAA Climate Reanalysis Task Force, 29 April 2015 Intro / Methodology / Products / Performance / Climate value / Uncertainties / Known issues / Unknowns / Future plans Comparison to independent observations to assess uncertainties (I): infrared spectra Nimbus-4 IRIS Apr 1970-Jan 1971 667 cm -1 15 m CO 2 1110 & 1043 cm -1 9.6 m O 3 1306 cm -1 7.6 m CH 4 Find out more about ongoing efforts on satellite data rescue: http://www.ecmwf.int/en/about/media-centre/news/2015/climate-reanalysis-data-challenge Stdev. for tropospheric (stratospheric) temperature soundings channels below 2K (3K) Channel number Mean obs. in cloud-clear areas
 temperature soundings channels below 2K (3K) Channel number Mean obs. in cloud-clear areas.")
14
Slide 14© ECMWF Presentation to NOAA Climate Reanalysis Task Force, 29 April 2015 Intro / Methodology / Products / Performance / Climate value / Uncertainties / Known issues / Unknowns / Future plans Comparison to independent observations to assess uncertainties (II): water vapor Stdev (Obs - ERA-20C) is about 7K Stdev (Obs) is about 21K Explained variance = (21*21-7*7) out of (21*21) ERA-20C explains about 90% of the variance in SSMI channel 3 (22GHz), whereas ERA-Interim explains 98% Comparison with SSM/I FCDR of brightness temperatures from CM SAF, by running RTTOV v11 at the time and location of the SSM/I observations, considering only clear-sky scenes over ice-free ocean
: water vapor Stdev (Obs - ERA-20C) is about 7K Stdev (Obs) is about 21K Explained variance = (21*21-7*7) out of (21*21) ERA-20C explains about 90% of the variance in SSMI channel 3 (22GHz), whereas ERA-Interim explains 98% Comparison with SSM/I FCDR of brightness temperatures from CM SAF, by running RTTOV v11 at the time and location of the SSM/I observations, considering only clear-sky scenes over ice-free ocean")
15
Slide 15© ECMWF Presentation to NOAA Climate Reanalysis Task Force, 29 April 2015 Intro / Methodology / Products / Performance / Climate value / Uncertainties / Known issues / Unknowns / Future plans Comparison to SSM/I highlights missing variability in ERA-20C Average SSM/I channel 2 (sees SST) brightness temperature from the FCDR for F10, F11, and F13, at 0.25 degree longitude resolution (horizontal axis) and per day of the year 1996 (vertical axis, from 1 January at the bottom to 31 December at the top) in the Eastern Tropical Pacific for latitudes 1.5 to 2.5 degree North, for clear-sky scenes after retaining longitudinal anomalies (12 deg window) and 20-50 days signal Computation from ERA-Interim, at the same times and locations as the observations Computation from ERA-20C ERA-20C is probably missing tropical instability waves, owing to monthly SST forcing (missing intra-month variability)
 brightness temperature from the FCDR for F10, F11, and F13, at 0.25 degree longitude resolution (horizontal axis) and per day of the year 1996 (vertical axis, from 1 January at the bottom to 31 December at the top) in the Eastern Tropical Pacific for latitudes 1.5 to 2.5 degree North, for clear-sky scenes after retaining longitudinal anomalies (12 deg window) and days signal Computation from ERA-Interim, at the same times and locations as the observations Computation from ERA-20C ERA-20C is probably missing tropical instability waves, owing to monthly SST forcing (missing intra-month variability)")
16
Slide 16© ECMWF Presentation to NOAA Climate Reanalysis Task Force, 29 April 2015 Intro / Methodology / Products / Performance / Climate value / Uncertainties / Known issues / Unknowns / Future plans Winds from buoys: we should have treated separately moored vs. drifting Note also the suspicion of some winds with 180 degree shift in direction u -u v -v

17
Slide 17© ECMWF Presentation to NOAA Climate Reanalysis Task Force, 29 April 2015 Intro / Methodology / Products / Performance / Climate value / Uncertainties / Known issues / Unknowns / Future plans ERA-20C rejected most of the (bogus) observations of tropical cyclone (TC) central pressure 20CR ERA-20C ensemble ERA-20C deterministic Here we rejected most data b/c of background check or VarQC Here we rejected most data b/c of an innovative QC that rejected constant time-series of observations… and central pressures can be constant for several days in IBTrACS! 20CR assimilated most TC bogus observations

18
Slide 18© ECMWF Presentation to NOAA Climate Reanalysis Task Force, 29 April 2015 Intro / Methodology / Products / Performance / Climate value / Uncertainties / Known issues / Unknowns / Future plans What is really happening in the Southern high latitudes? ~10 hPa drop in ERA-20C and 20CR: is it real? Note, it is not seen in an AMIP run (ERA-20CM) Problem first pointed out, to my knowledge, by Dave Bromwich and Julien Nicolas
 Problem first pointed out, to my knowledge, by Dave Bromwich and Julien Nicolas.")
19
Slide 19© ECMWF Presentation to NOAA Climate Reanalysis Task Force, 29 April 2015 Intro / Methodology / Products / Performance / Climate value / Uncertainties / Known issues / Unknowns / Future plans Computing maps of departures with respect to ERA-20C, the AMIP (ERA-20CM), and 20CR …suggests that observations of pressure reported at the highest latitudes do not agree with the free model integration. Yet all such observations are consistent between one another (all collections have the same behavior). Who’s right then? The pressure observations, or the (sea-ice-driven) model? Is the forcing ‘suboptimal’? See animation for several years, and other videos, at https://www.youtube.com/playlist?list=PLNgQfkVXCl8gQKXkXEUBEygfSreSwNY1Z
. Who’s right then. The pressure observations, or the (sea-ice-driven) model. Is the forcing ‘suboptimal’. See animation for several years, and other videos, at list=PLNgQfkVXCl8gQKXkXEUBEygfSreSwNY1Z.")
20
Slide 20© ECMWF Presentation to NOAA Climate Reanalysis Task Force, 29 April 2015 Intro / Methodology / Products / Performance / Climate value / Uncertainties / Known issues / Unknowns / Future plans ECMWF Reanalyses (not including chemistry and composition) ERA-40 ERA-15 Observation Diversity 190019502000 2020 +Surface +Upper-air +Satellites +Sub- surface Forcings (SST, sea-ice…) ORA-S5 ERA5
 ERA-40 ERA-15 Observation Diversity Surface +Upper-air +Satellites +Sub- surface Forcings (SST, sea-ice…) ORA-S5 ERA5")
21
Slide 21© ECMWF Presentation to NOAA Climate Reanalysis Task Force, 29 April 2015 Intro / Methodology / Products / Performance / Climate value / Uncertainties / Known issues / Unknowns / Future plans Adding observations to ERA-20C: trial for 1940-1964 Note how adding upper-air observations takes the mean state from ERA-20C (biased cold in troposphere) to a state-of-the-art product like JRA-55 Unanswered question of how to treat this optimally in a 20 th century reanalysis starting without upper- air observations… A. Simmons

22
Slide 22© ECMWF Presentation to NOAA Climate Reanalysis Task Force, 29 April 2015 Conclusions

23
Slide 23© ECMWF Presentation to NOAA Climate Reanalysis Task Force, 29 April 2015 Conclusions ERA-CLIM initiated a new class of reanalyses: ERA-20C family –All results can be analyzed w.r.t to a model integration baseline, ERA-20CM –ERA-20C iterated once, with a second production that applied lessons from the first production. Products available online since 1 Oct 2014 at http://apps.ecmwf.int/datasets/ –Observation feedback published online in a user-friendly interface (last-minute update: deployment now scheduled for Wednesday 6 May 2015) –Not our last and final product, we will hopefully make new versions! ERA-CLIM2 funds R&D for next-generation reanalyses –To couple with ocean –To increase observation diversity in century-long reanalyses More ERA-20C products to be released soon –Monthly means, and possibly ensemble spreads –ERA-20CL: land-surface model driven by meteorological forcing from ERA-20C
 –Not our last and final product, we will hopefully make new versions. ERA-CLIM2 funds R&D for next-generation reanalyses –To couple with ocean –To increase observation diversity in century-long reanalyses More ERA-20C products to be released soon –Monthly means, and possibly ensemble spreads –ERA-20CL: land-surface model driven by meteorological forcing from ERA-20C.")
24
Slide 24© ECMWF Presentation to NOAA Climate Reanalysis Task Force, 29 April 2015 Extra slides

25
Slide 25© ECMWF Presentation to NOAA Climate Reanalysis Task Force, 29 April 2015 Intro / Methodology / Products / Performance / Climate value / Uncertainties / Known issues / Unknowns / Future plans ERA-20C productions ● Ensemble run had pushed the envelope of what ECMWF infrastructure can deliver in terms of reanalyses: –6 streams of 10 members each. Completed in 200 days ● Deterministic run employed 22 streams. Peak production yield was 15 Tb in 1 day –Planned from the onset as a “blitz run”, under 100 days –Actually took around 50 days (not removing downtimes, would have been faster otherwise) –Started around Christmas time when fewer people were around to mess with overall machine load, then adjusted for timing and scheduling for next 10 days –Once stable (evening of 31 December 2013), each stream produced 50days/day ● “Production hangover”: after this we were left with about 1 Petabyte of data to organize for release. We are finally getting there now.
 –Started around Christmas time when fewer people were around to mess with overall machine load, then adjusted for timing and scheduling for next 10 days –Once stable (evening of 31 December 2013), each stream produced 50days/day ● Production hangover : after this we were left with about 1 Petabyte of data to organize for release. We are finally getting there now..")
26
Slide 26© ECMWF Presentation to NOAA Climate Reanalysis Task Force, 29 April 2015 Intro / Methodology / Products / Performance / Climate value / Uncertainties / Known issues / Unknowns / Future plans Why 2 productions of ERA-20C? ● The 10-member ensemble production was required: –To compute background error covariances: ‘B matrix’ of Variational assimilation –Ensemble used its own, self-generated background errors –Brand new idea in 2013, only made it to ECMWF NWP operations recently. ● What happened in this ERA-20C ensemble: –In the upper troposphere and above, the background error variances (derived from the ensemble spread) were sometimes large (>several K). –The background errors contained remote vertical correlations. –The combination of the two lead the 4DVAR to spread information from the surface all the way up. –Slowly-varying systematic analysis increments made an imprint in the stratosphere, destroying forcing-led low-frequency (good) information. –Trying out vertical localizations in the 4DVAR ruined its synoptic quality. ● Only option was to re-do a production without using the ensemble-generated background error correlations –Advantage: this could be done without an ensemble: deterministic production. –Resulted in much better upper-air climate, but slightly worse meteorology
 were sometimes large (>several K). –The background errors contained remote vertical correlations. –The combination of the two lead the 4DVAR to spread information from the surface all the way up. –Slowly-varying systematic analysis increments made an imprint in the stratosphere, destroying forcing-led low-frequency (good) information. –Trying out vertical localizations in the 4DVAR ruined its synoptic quality. ● Only option was to re-do a production without using the ensemble-generated background error correlations –Advantage: this could be done without an ensemble: deterministic production. –Resulted in much better upper-air climate, but slightly worse meteorology.")
27
Slide 27© ECMWF Presentation to NOAA Climate Reanalysis Task Force, 29 April 2015 Intro / Methodology / Products / Performance / Climate value / Uncertainties / Known issues / Unknowns / Future plans ERA-20C deterministic re-run also fixed other problems: Issues in ERA-20C ensemble Solutions adopted

28
Slide 28© ECMWF Presentation to NOAA Climate Reanalysis Task Force, 29 April 2015 Intro / Methodology / Products / Performance / Climate value / Uncertainties / Known issues / Unknowns / Future plans ERA-20C forecast scores This is confirmed by the forecast scores

29
Slide 29© ECMWF Presentation to NOAA Climate Reanalysis Task Force, 29 April 2015 Intro / Methodology / Products / Performance / Climate value / Uncertainties / Known issues / Unknowns / Future plans Observation feedback metrics (both ERA-20C runs) Shading shows work done by observation bias correction instead of the work done by the meteorological analysis to adjust the whole atmospheric state to fit the data Before bias correction After bias correction Mean sea level pressure
 Shading shows work done by observation bias correction instead of the work done by the meteorological analysis to adjust the whole atmospheric state to fit the data Before bias correction After bias correction Mean sea level pressure")
30
Slide 30© ECMWF Presentation to NOAA Climate Reanalysis Task Force, 29 April 2015 Intro / Methodology / Products / Performance / Climate value / Uncertainties / Known issues / Unknowns / Future plans Climate value for temperature ERA-20C ensemble ERA-20C deterministic Model level 30 (about 50 hPa) Model level 71 (about 700 hPa) Model level 89 (near-surface) 2-meter 1 st ERA-20CM run CRUTEM4 data (Jones et al., 2012) ERA-20CM ERA-20C deterministic ERA-20C ensemble ERA-20C deterministic ERA-20C ensemble ERA-20C deterministic A. Simmons

Similar presentations

, R. Bennartz (2), J. Schulz (3), A. Walther (2,4),>")


 John Scinocca, Slava Kharin.>")


 to an Ensemble of Analyses Including CFSR Wesley Ebisuzaki 1, Fedor Mesinger 2, Li Zhang.>")

