Download presentation
Presentation is loading. Please wait.

1
RUSSIAN AND UKRAINIAN BEER MARKET HIGHLIGHTS 1997-2002
March 2003

2
BEVERAGE MARKET BY DRINK CATEGORY - RUSSIA
Total volume, Million hl Total 253 257 254 274 320 359 Million hl Share of beer 10.9% 12.9% 17.8% 19.0% 19.1% 18.7% % Beer volume 27.6 33.1 45.3 52.3 61.0 67.0 Million hl *Liquid milk consumption, of which approximately half is used in cooking Source: Canadean: Annual Report 2002 Russia

3
BEVERAGE MARKET BY DRINK CATEGORY - RUSSIA
Consumption of Beverages per capita; Liter Alcoholic intake per capita; Liter Source: Canadean: Annual Report 2002 Russia

4
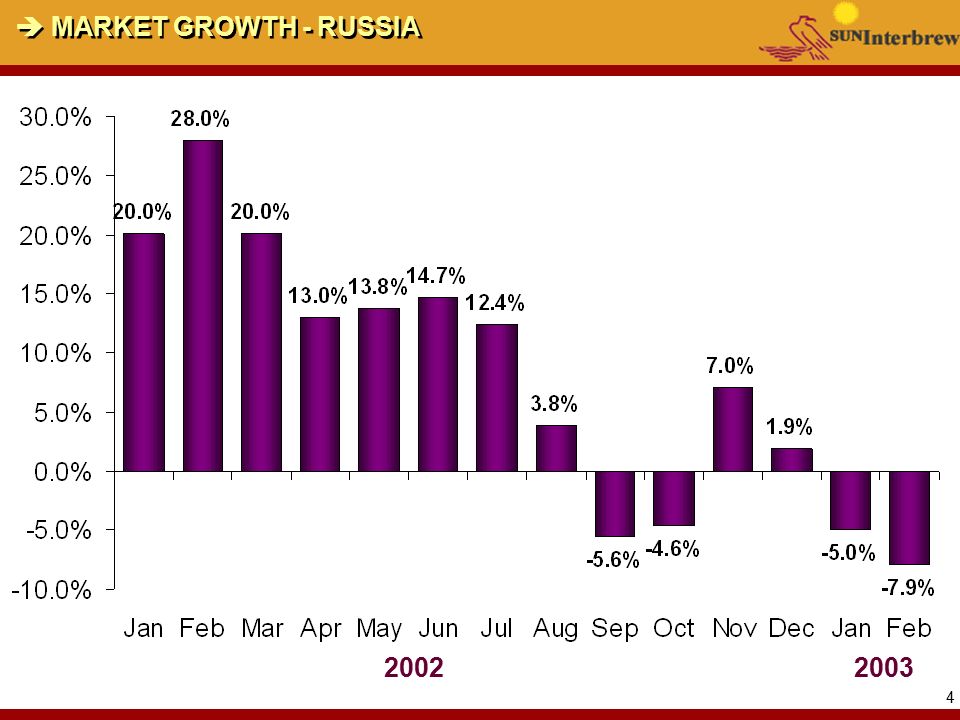
MARKET GROWTH - RUSSIA
2002 2003
5
MARKET VOLUME BY PACK - RUSSIA

6
BEVERAGE MARKET BY DRINK CATEGORY - UKRAINE
Total volume, Million hl Total 17.0 19.1 23.6 27.4 33.0 35.9 Million hl Share of beer 33% 33% 34% 36% 35% 38% % Beer volume 5.6 6.3 8.0 9.7 11.5 13.5 Million hl Source: Ukrpivo & Derzhcomstat

7
BEVERAGE MARKET BY DRINK CATEGORY - UKRAINE
Consumption of Beverages per capita; Liter Consumption of beer per capita, Liter/year 11.2 12.6 16.1 19.8 23.6 27.8 Alcoholic intake per capita; Liter Total alcoholic intake per capita, LiterYear 19.8 21.2 25.1 30.1 34.0 37.3 Beer share of alcoholic intake Source: Ukrpivo & Derzhcomstat 57% 60% 64% 66% 70% 75%

Similar presentations


>")


