Download presentation
Presentation is loading. Please wait.

1
MIND MAPS: Issue: Inequality People involved: Wealthy and Poor Areas Involved: City (urban) & Country (rural) / In cities Consequences: What is life like? Solutions: What is life like?

3
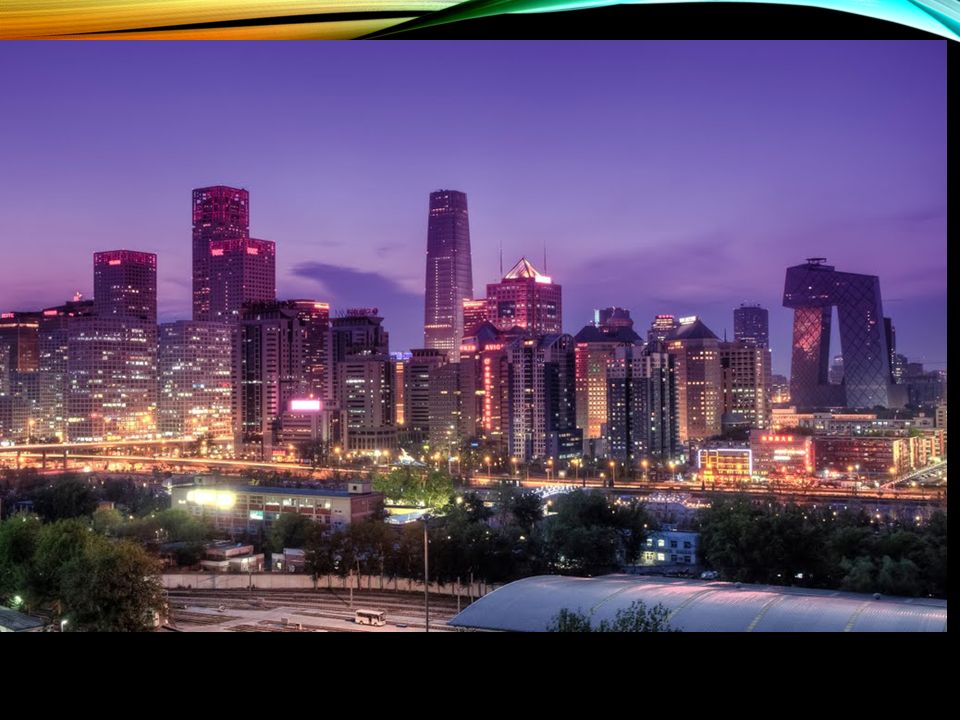
Daily life

5
As in any country, there are always areas of wealth and areas of poverty……

8
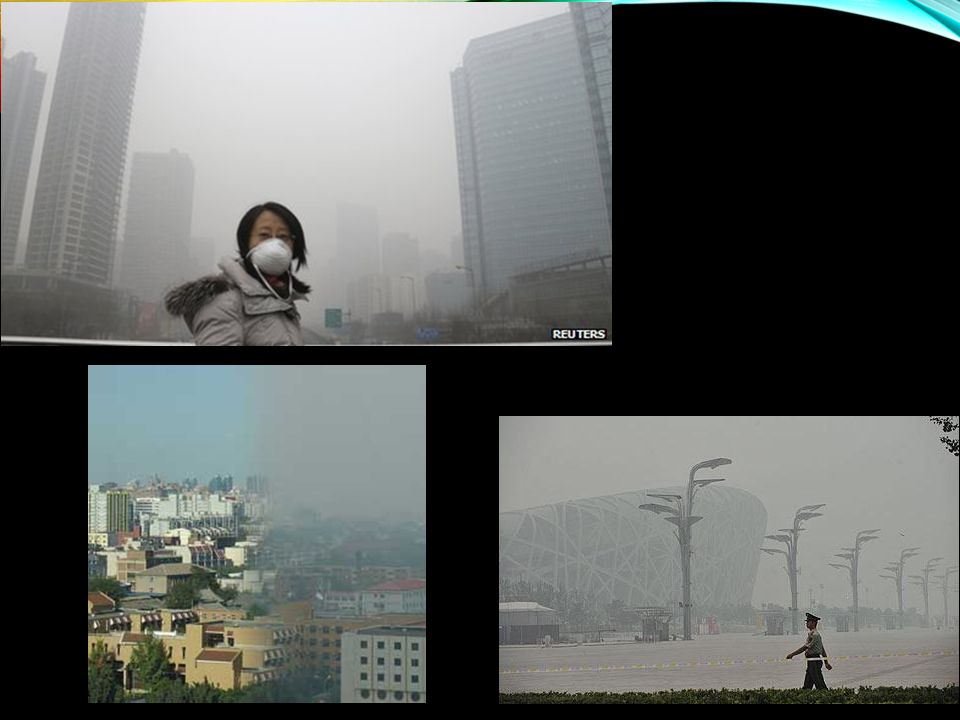
http://www.marketplace.org/topics/sustainability/what-would-your-city- look-beijings-air-smog-simulator

9
MY TIME IN CHINA

10
ALONE: Underline the main points of your article Highlight the words you don’t know IN PAIRS: Get in your groups; discuss the words you don’t know List the most important main points from article Do some research and decide whether China can “change course” from its current actions. Make a list of all the steps China has taken to fix the issue with specific statistics

11
TASK: CREATE AN INFOGRAPHIC OUTLINING ONE OF THE 6 MAJOR ENVIRONMENTAL CONCERNS FOR CHINA AND THE WORLD

12
INFOGRAPHICS…

13
WHAT IS AN INFOGRAPHIC?

14
TASK: CREATE AN INFOGRAPHIC POSTER OUTLINING ONE OF THE 6 MAJOR ENVIRONMENTAL CONCERNS IN CHINA Place your issue as a title somewhere on your poster. Decide where you will put the rest of the info Description of the type of pollution Where does it happen in China? And the world Why does it happen? Consequences for the wider world? What has China done to ‘change course’? How? What does the world need to do?

15
CATEGORY7-85-63-41-2 Graphics - RelevanceAll graphics are related to the topic and make it easier to understand. Detail is evident.. At least 5 graphics are evident from the poster All graphics are related to the topic and most make it easier to understand. Some detail has been shown. Four graphics are evident, All graphics relate to the topic. Some detail has been taken. Less than 3 graphics are evident Graphics do not relate to the topic. Very little detail is present. Graphics are unrelated to poster topic. Content - AccuracyAt least 6 accurate facts are displayed on the poster. Students show exceptional understanding of their chosen issue. 4-5 accurate facts are displayed on the poster. Students show solid understanding of their issue. 3-4 accurate facts are displayed on the poster. Students show understanding of their chosen issue. Less than 3 accurate facts are displayed on the poster. Students do not seem to understand their issue. Style - OriginalityThe poster is exceptionally attractive in terms of design, layout, and neatness. Multiple colours are used but not too many as to overwhelm picture. The poster is attractive in terms of design, layout and neatness. The poster is acceptably attractive though it may be a bit messy and/or unorganized. The poster is distractingly messy or very poorly designed. Use of Class TimeUsed time well during each class period. Focused on getting the project done. Never distracted others. Used time well during each class period. Usually focused on getting the project done and never distracted others. Used some of the time well during each class period. There was some focus on getting the project done but occasionally distracted others. Did not use class time to focus on the project OR often distracted others.

Similar presentations

 TO MAKE IT INTERESTING! WHEN YOU ARE DONE, SAVE.>")


![Student Page Title Introduction Task Process Evaluation Conclusion Credits [Teacher Page]Teacher Page Based on a template from The WebQuest PageThe WebQuest.](/22/6367224/big_thumb.jpg "Student Page Title Introduction Task Process Evaluation Conclusion Credits [Teacher Page]Teacher Page Based on a template from The WebQuest PageThe WebQuest.>")


 & Country (rural) / In cities Consequences: What is life like?>")


