Download presentation
Presentation is loading. Please wait.

2
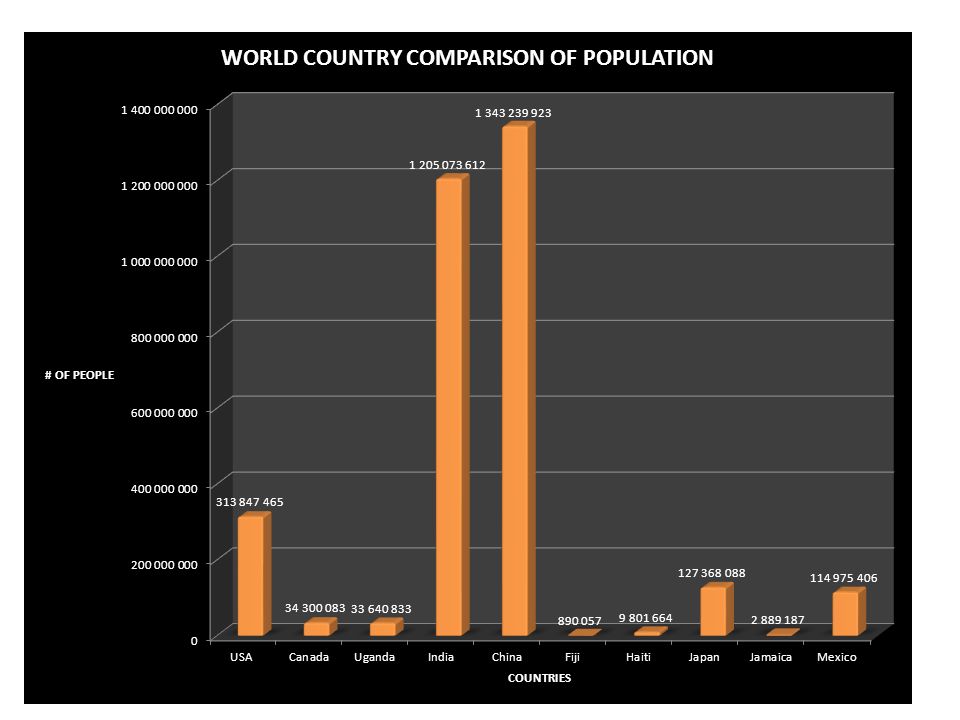
Questions Answer these questions for each of your 3 charts that you made in Excel. Post them on the slide after the chart that you copied and pasted in PowerPoint. 1.What country has the largest column? What are the reasons that you think that this country has the highest amount? The country with the largest column is China. I think that because it’s a high population 2.What country has the smallest/lowest? What reasons would cause this country to have a low amount?The country with the lowest amount is Fiji because it’s a low population and a developing country 3.Look at the 5 th and 6 th ranked countries. Are they developed, developing, or one of each? Why do you think that they are where they are in the rankings? Use data to help you answer the question. Canada is a developed country but has a small population almost 80 % of the people have internet access and Mexico is between developing and developed country and less than 1/3 of the population has internet access 4.Look at the 7 th and 8 th ranked countries. Are they developing countries? If so, what do they need to do in order to get to the top half of the rankings? Use data from any information to help you answer the question. Jamaica is a developing country but has a small population and therefore less internet users, but half the population are internet users; Uganda is a developing country, and only 10% of the population has internet access, even though it has more internet users overall than Jamaica. 5.Name another country (other than the US) that stands out to you on the chart. Describe the country and what type of impact it has on world internet use. China has the most population and a high literacy rate and therefore has the highest potential number of internet users.
 that stands out to you on the chart. Describe the country and what type of impact it has on world internet use. China has the most population and a high literacy rate and therefore has the highest potential number of internet users..")
4
Questions 1.What country has the largest column? What are the reasons that you think that this country has the highest amount? The country with the largest column is China because it has the highest population. China has a large population because it is a very large country, with lots of land and many very large cities. China has had settled civilizations for thousands of year. 2.What country has the smallest/lowest? What reasons would cause this country to have a low amount? Fiji has the smallest amount because it is a small island nation. There is not a lot of land on Fiji. 3.Look at the 5 th and 6 th ranked countries. Are they developed, developing, or one of each? Why do you think that they are where they are in the rankings? Use data to help you answer the question. Mexico and Canada are 5 th & 6 th. Canada is a developed country but has a small population because much of the land is tundra and it’s not really livable. Mexico is between developed and developing, it has three times the population of Canada because it is a large country on usable land. 4.Look at the 7 th and 8 th ranked countries. Are they developing countries? If so, what do they need to do in order to get to the top half of the rankings? Use data from any information to help you answer the question. Uganda and Haiti are developing countries. Haiti is on an island and so has limited growth potential. Uganda is a relatively small African nation with three times the population of Haiti. With small GDP’s per capita, it would be better to improve the lives of the people already there than try to have more people. 5.Name another country (other than the US) that stands out to you on the chart. Describe the country and what type of impact it has on world consumption. India has a big impact because it has the second largest population in the world after China.
 that stands out to you on the chart. Describe the country and what type of impact it has on world consumption. India has a big impact because it has the second largest population in the world after China..")
6
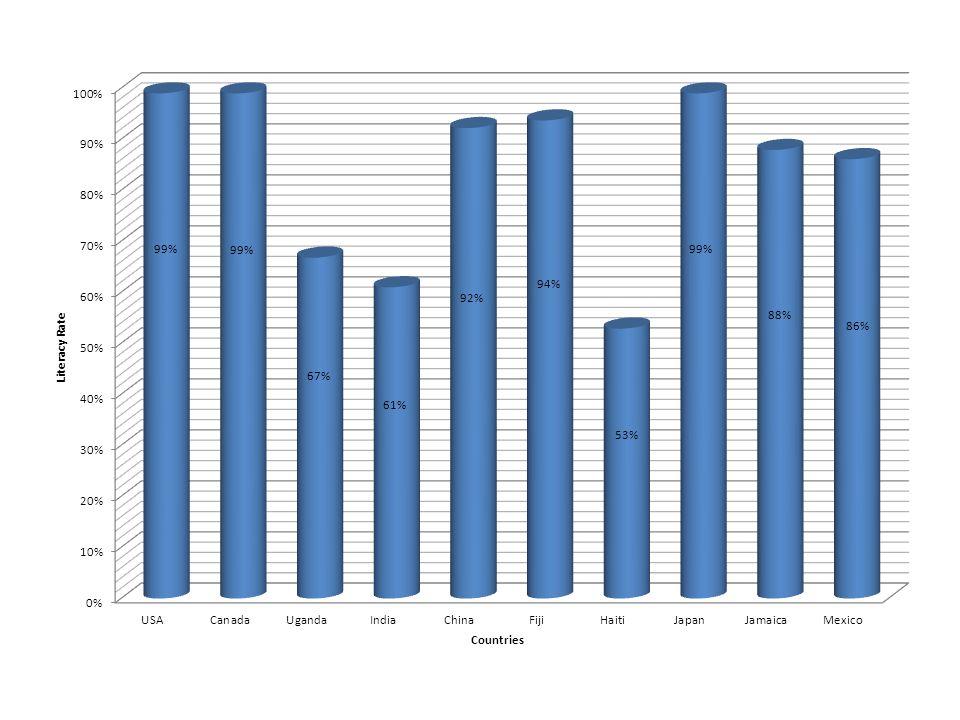
Questions Answer these questions for each of your 3 charts that you made in Excel. Post them on the slide after the chart that you copied and pasted in PowerPoint. 1. What country has the largest column? What are the reasons that you think that this country has the highest amount? USA, Canada and Japan are developed countries that educate their citizens 2. What country has the smallest/lowest? What reasons would cause this country to have a low amount? Haiti has the lowest amount because it has the lowest GDP per capita and education is not as avalible 3. Look at the 5 th and 6 th ranked countries. Are they developed, developing, or one of each? Why do you think that they are where they are in the rankings? Use data to help you answer the question. China and Jamaica are 5 th and 6 th and the have similar GDP per capita and there developing countries 4. Look at the 7 th and 8 th ranked countries. Are they developing countries? If so, what do they need to do in order to get to the top half of the rankings? Use data from any information to help you answer the question. Mexico and Uganda are developing countries and are ranked 7 th and 8 th they could educate more people to improve their literacy rate. 5.Name another country (other than the US) that stands out to you on the chart. Describe the country and what type of impact it has on world consumption. Even though Fiji has a low GDP per capita, they have a high literacy rate, if you knew why, you might be able to do whatever they are doing to have a high literacy rate even without a lot of money.
 that stands out to you on the chart. Describe the country and what type of impact it has on world consumption. Even though Fiji has a low GDP per capita, they have a high literacy rate, if you knew why, you might be able to do whatever they are doing to have a high literacy rate even without a lot of money..")
Similar presentations


What country has the largest column? What are the reasons that you think that this country has the highest amount? 2)China has the largest column because.>")


. What country has the largest column? What are the reasons that you think that this country.>")


