Download presentation
Presentation is loading. Please wait.

1
Histograms and Distributions Experiment: Do athletes have faster reflexes than non-athletes? Questions: - You go out and 1st collect the reaction time of 25 non- athletes.

2
Histograms and Distributions Data on the left. Arranged lowest to highest on the right. Calculate the mean score… 278.5 What does it mean???

3
Histograms and Distributions Calculate the mean score… 264.4 Compare: athletesNon- athletes mean 264.4278.5

4
Histograms and Distributions Data on the left. Arranged lowest to highest on the right. Make a histogram to display the data…

5
Histograms and Distributions Histogram = a plot of frequency Non-athletes

6
Histograms and Distributions Athletes

7
Histograms and Distributions AthletesNon-athletes MEAN: 264.4 278.5

8
Histograms and Distributions Standard deviation (sigma) Normal or Gaussian Distribution
 Normal or Gaussian Distribution")
9
Histograms and Distributions How do we determine the standard deviation (sigma)?
")
10
Histograms and Distributions 1. Find the distance between each value and the mean

11
Histograms and Distributions 2. Square all the differences

12
Histograms and Distributions 3. Sum all the squares 23957.13

13
Histograms and Distributions 4. Divide the sum by the number of scores minus 1 23957.13 24 998.2 (variance)
.")
14
Histograms and Distributions 5. Take the square root of the variance 31.6 (standard deviation)
")
15
Histograms and Distributions Standard deviation formula: - the square root of the sum of the squared deviations from the mean divided by the number of scores minus one

16
Histograms and Distributions Standard deviation formula: Non-athletes: 278.5 31.6 Athletes: 264.4 30.6 Are these groups statistically different from each other??

17
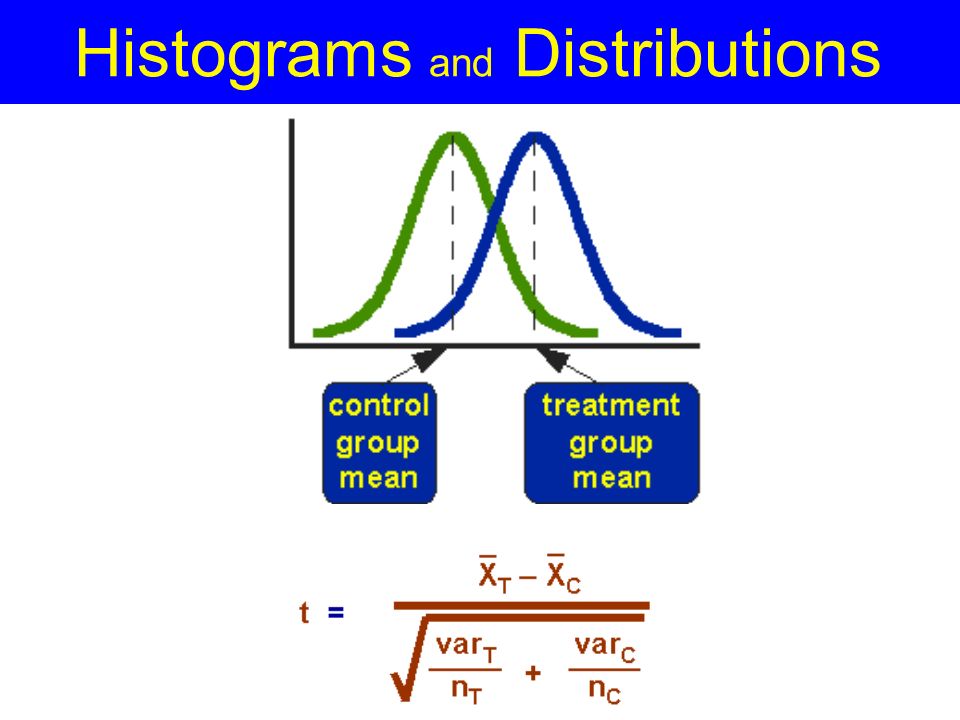
Histograms and Distributions T-Test assesses whether the means of two groups are statistically different from each other

18
Histograms and Distributions

20
= Standard Error of the difference

21
Histograms and Distributions

23
t = -1.61 -Degrees of freedom is the sum of the people in both groups minus 2 df = 48

24
Histograms and Distributions http://bioinfo-out.curie.fr/ittaca/documentation/Images/ttable.gif

Similar presentations


>")


