Download presentation
Presentation is loading. Please wait.

1
Sustaining the Regional Economy Barry Bluestone Dean, School of Social Science, Urban Affairs, and Public Policy Director, Center for Urban and Regional Policy Northeastern University November 2006

2
Presentation Outline Employment Trends Population Dynamics Housing Prices Cost of Living across U.S. Metro Areas Impact of Housing Prices on Employment Impact of Housing Prices on Migration The Location Decision of Firms

3
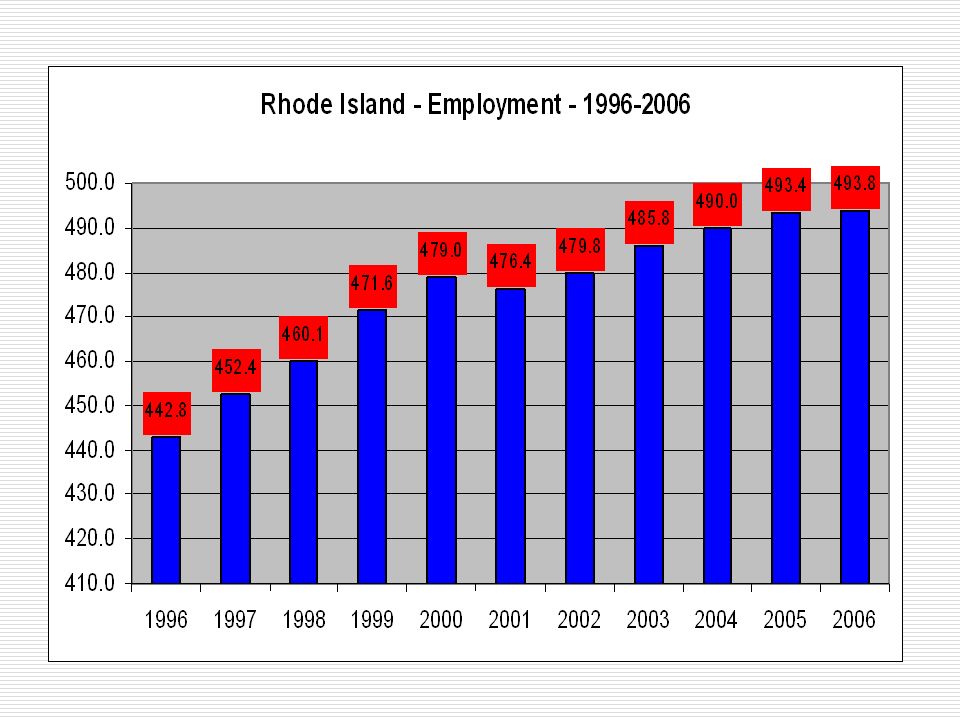
Winners and Losers in the Employment Game

6
New England vs. U.S. Employment (1996-2006)
")
14
U.S. Bureau of Labor Statistics

15
Massachusetts Population Dynamics

16
U.S. Bureau of the Census

17
U.S. Census Bureau

18
U.S. Bureau of the Census

20
Where did they go?

21
First Culprit: The Cost of Living

22
Greater Boston Median Single Family Home Price 1987-2004 Source: The Warren Group Publications

23
2005 Class A Apartment Rents Source: Forbes Magazine Calculations based on 900 Sq.Ft. Apartment

24
Source: Economic Policy Institute, “Family Budget Calculator, 2005”

25
Boston $64,656 Source: Economic Policy Institute, “Family Budget Calculator, 2005” Universe: 304 U.S. Metro Areas

26
Greater Boston Family Budget 4 Person Family with 2 Children Housing Costs: 7 th Highest MSA Child Care: 7 th Highest MSA Health Care: 7 th Highest MSA Personal Care: 6 th Highest MSA Fed/State Tax: 2 nd Highest MSA Total Cost: 1 st Highest MSA Economic Policy Institute, Family Budget Calculator, 2005 Among 304 U.S. Metropolitan Areas

27
Top Decile: Metro Area Cost of Living Boston $ 64,656 Washington (D.C. portion) $ 61,440 Nassau-Suffolk, NY $ 60,780 Stamford-Norwalk, CN$ 60,720 Lawrence (Mass. portion) $ 59,280 New York, NY$ 58,656 Barnstable-Yarmouth, MA $ 58,236 San Francisco, CA $ 57,624 Worcester (Mass. portion) $ 55,704 Springfield, MA$ 55,320 Minneapolis-St. Paul, MN$ 54,948 Nashua, NH $ 54,852 Santa Cruz-Watsonville, CA$ 53,808 Oakland, CA $ 53,412 San Jose, CA $ 52,800 Pittsfield, MA $ 52,632 Rochester, MN $ 51,288 Monmouth-Ocean, NJ$ 50,736 San Diego, CA $ 50,088 Newark, NJ$ 49,992 New Haven-Meriden, CN $ 49,848 Honolulu, HI $ 49,824 Philadelphia (Pa. portion) $ 49,716 Boulder-Longmont, CO$ 49,596 Bridgeport, CN$ 49,272 Manchester, NH $ 49,152 Santa Rosa, CA$ 48,924 Albany-Schenectady-Troy, NY $ 48,900 Hartford, CN$ 48,684 Trenton, NJ$ 48,576 Rochester, NY$ 48,540 Economic Policy Institute: Family Budget Calculator Universe: 304 U.S. Metro Areas
 $ 61,440 Nassau-Suffolk, NY $ 60,780 Stamford-Norwalk, CN$ 60,720 Lawrence (Mass. portion) $ 59,280 New York, NY$ 58,656 Barnstable-Yarmouth, MA $ 58,236 San Francisco, CA $ 57,624 Worcester (Mass. portion) $ 55,704 Springfield, MA$ 55,320 Minneapolis-St. Paul, MN$ 54,948 Nashua, NH $ 54,852 Santa Cruz-Watsonville, CA$ 53,808 Oakland, CA $ 53,412 San Jose, CA $ 52,800 Pittsfield, MA $ 52,632 Rochester, MN $ 51,288 Monmouth-Ocean, NJ$ 50,736 San Diego, CA $ 50,088 Newark, NJ$ 49,992 New Haven-Meriden, CN $ 49,848 Honolulu, HI $ 49,824 Philadelphia (Pa. portion) $ 49,716 Boulder-Longmont, CO$ 49,596 Bridgeport, CN$ 49,272 Manchester, NH $ 49,152 Santa Rosa, CA$ 48,924 Albany-Schenectady-Troy, NY $ 48,900 Hartford, CN$ 48,684 Trenton, NJ$ 48,576 Rochester, NY$ 48,540 Economic Policy Institute: Family Budget Calculator Universe: 304 U.S. Metro Areas.")
28
A Tale of Two Cities Basic Budget 2 Parents, 2 Children Boston Monthly Housing$1,266 Monthly Food$ 587 Monthly Child Care$1,298 Monthly Transportation$ 321 Monthly Health Care$ 592 Monthly Other Necessity$ 500 Monthly Taxes$ 824 Monthly Total$5,388 Annual Total $64,656 Raleigh-Durham- Chapel Hill Monthly Housing$ 779 Monthly Food$ 587 Monthly Child Care$ 866 Monthly Transportation$ 358 Monthly Health Care$ 368 Monthly Other Necessity$ 369 Monthly Taxes$ 350 Monthly Total$3,677 Annual Total $ 44,124 A Tale of Two Cities Source: Economic Policy Institute, “Family Budget Calculator, 2005”

29
Boston ($1,266) Source: Economic Policy Institute, “Family Budget Calculator, 2005”
 Source: Economic Policy Institute, Family Budget Calculator, 2005")
30
Impact of Cost of Living on Employment

31
Low PriceHigh Price Economic Policy Institute, “Family Budget Calculator, 2005”; U.S. Bureau of Labor Statistics Universe: 245 U.S. Metro Areas 0.95% 2.91% 2.29% 0.86% 1.53% 0.68% -0.68% 0.12% -0.62% 1.49%

32
Boston MSA (-4.9%) Economic Policy Institute, “Family Budget Calculator, 2005”; U.S. Bureau of Labor Statistics Universe: 245 U.S. Metro Areas

33
Monthly Housing Cost Employment Change (%) (2000-2004) Boston MSA %∆Emp(2000-2004) = -.1466 +.0000396 Housing Cost (4.07) -2.291E-007 Housing Cost SQ (4.04) N = 245 Adj. R Square =.056

34
Low CostHigh Cost Economic Policy Institute, “Family Budget Calculator, 2005”; U.S. Bureau of Labor Statistics -0.21% 0.93% -0.02% 0.84% 1.06% 0.50% 1.09% 1.98% 0.62% 2.53% Universe: 245 U.S. Metro Areas

35
Impact of Cost of Living on Internal Migration

36
Economic Policy Institute, “Family Budget Calculator, 2005”; U.S. Bureau of the Census Boston MSA (-5.2%) Universe: 304 U.S. Metro Areas
 Universe: 304 U.S. Metro Areas.")
37
Internal Migration (% Change) Monthly Housing Cost Boston MSA %∆Internal Migration = -.1541 +.00043 Housing Costs (7.03) - 2.658E-007 Housing Costs SQ (7.39) N = 304 Adj. R Square =.153 Universe: 304 U.S. Metro Areas

38
Internal Migration (% Change) Monthly Housing Cost Boston MSA %∆Internal Migration = -.146 +.000399 Housing Costs (7.03) - 2.475E-007 Housing Costs SQ (7.39) N = 304 Adj. R Square =.153 San Francisco Stamford-Norwalk San Jose Boston Oakland Nassau-Suffolk

39
Simulation Results The Impact of Employment Growth and Housing Prices on Net Internal Migration (Northeastern States) Monthly Housing Cost % Employment Growth $600$1,266 +5.0%+ 2.27%- 0.77% +2.5%+ 1.30%- 1.74% -4.85%- 1.54%- 4.58% Simulation based onNortheast Regression The -4.85% employment loss and the $1,266 monthly housing price refer to the values for Greater Boston, the former from the U.S. Bureau of Labor Statistics, the latter from the EPI Family Budget Calculator (4-Person Family with 2 Children)
.")
40
Economic Policy Institute, “Family Budget Calculator, 2005”; U.S. Bureau of the Census Universe: 304 U.S. Metro Areas

41
Winners and Losers in the Business Location Decision Results from NAIOP/CoreNET Survey of Developers and Location Specialists

42
2005 Survey Survey Sample = 230 Location Factors = 40 Project Types Rated Commercial/Professional General Industrial Mixed Use Retail R&D Facility Manufacturing

43
Factors Identified Among Top 7 “ Most Critical ” by Respondents Factor Number of Mentions in Respondents’ “Top 5” Lists* Proximity to major highways / airports / transportation routes 131 Rents / land costs / lease costs 127 Availability of appropriate labor pool 127 Permitting / approvals / appeals processes 60 Amenities and services nearby 49 Pro-business attitude of municipality / development-friendly city 49 Quality of life 46

44
Factors Identified Among 7 “Least Critical” by Respondents FactorNumber of Mentions in Respondent’s “Top 5 Lists” State/Local Incentives 32 State/Local Taxes 24 Cost of Labor 21 Environmental Issues 5 Unions 4 Local Minimum Wage 0 Proximity to Research/Universities* 0

45
Conclusions The high price of housing is indeed a significant factor in the decline in employment and population in Massachusetts and Connecticut The high cost of living beyond housing – including health care, day care, and taxes – contributes to the decline in employment and population Business Location today is based less on tax rates and tax incentives than quick municipal response, quality labor force, and access to transportation

46
General Policy Implications INCREASING the housing stock, particularly starter homes for young families is critical to the future economic development and prosperity of Massachusetts and Connecticut REDUCING the high cost of health care, day care, and reduce the tax burden (particularly the residential property tax which contributes to housing costs) is important as well … along with assuring that the quality of local public services encourages families to stay in the Commonwealth despite its relatively high cost
 is important as well … along with assuring that the quality of local public services encourages families to stay in the Commonwealth despite its relatively high cost")
47
General Conclusions In the new global economy, to attract investment and jobs, municipal government officials need to work closely with developers to reduce the regulatory burden and accelerate the speed from deal to delivery Focusing on tax incentives to businesses is misplaced development strategy Today, speed to market is critical … fix this problem first

Similar presentations


>")
 Outer Western Sydney Innovation Survey launch.>")


MLIC-LD Study of International Employee Benefits Trends Mexico.>")


