Download presentation
Presentation is loading. Please wait.

1
Golden Valley, Minnesota Image Analysis Heather Hegi and Kerry Ritterbusch

2
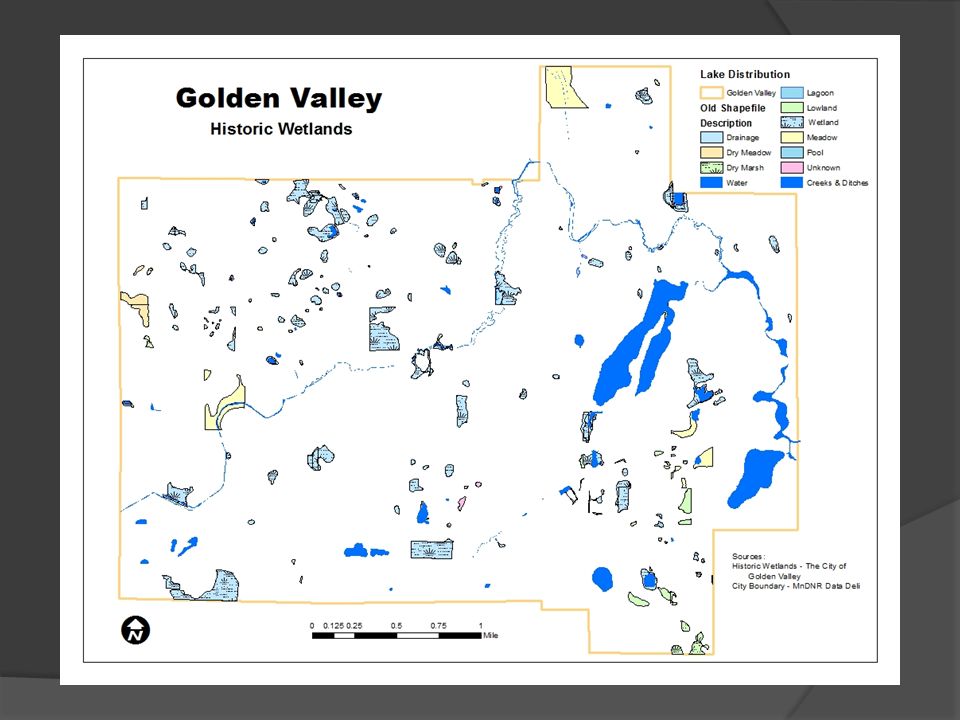
Objectives Project for City of Golden Valley Create accurate shapefiles of their historic water features Important for future building projects Necessary for maintenance of current structures

4
Data/Materials 1937 and 1945 panchromatic images 1937 – used for confirmation 1945 – wetter year (water features easily identifiable)
")
5
Data/Materials May 2009 multispectral image City boundary High resolution DEM Current lakes

6
Procedures Put 1937 images into continuous image mosaic (1945 & 2009 images already continuous) Digitized historic water features employing ’37 & ’45 imagery Performed unsupervised classification on 2009 imagery Conducted change detection between the 1945 and 2009 lake shapefiles
 Digitized historic water features employing ’37 & ’45 imagery Performed unsupervised classification on 2009 imagery Conducted change detection between the 1945 and 2009 lake shapefiles")
7
Problems with panchromatic images Running a normal classification as is done with a multispectral image does not work on black and white imagery Performed Digitization

8
One difficulty associated with semi-automated analysis of historical photographs, however, is that these images contain limited information – typically a single, panchromatic spectral band. Traditional methods of analysing such images assume that pixels in the same land-cover class are spectrally similar. This method is sub-optimal for several reasons. Even in relatively simple landscapes, individual land-cover classes (e.g. ‘forest’) may comprise a broad range of pixel spectral values, which may overlap with the ranges of other land- cover classes. (Pringle et al., 2009, p. 545)
 may comprise a broad range of pixel spectral values, which may overlap with the ranges of other land- cover classes. (Pringle et al., 2009, p. 545).")
9
Factors in Image Classification of Lakes Turbidity Color Placidity or Roughness of surface Caused by: Disturbed sediment Pollution Aquatic flora Wind and water speed

10
Unsupervised Classification Found that fewer classes were better 7 classes22 classes

11
Imagery Considerations 2010 NAIP – Many shades of lakes 2010 Landsat – Course resolution

12
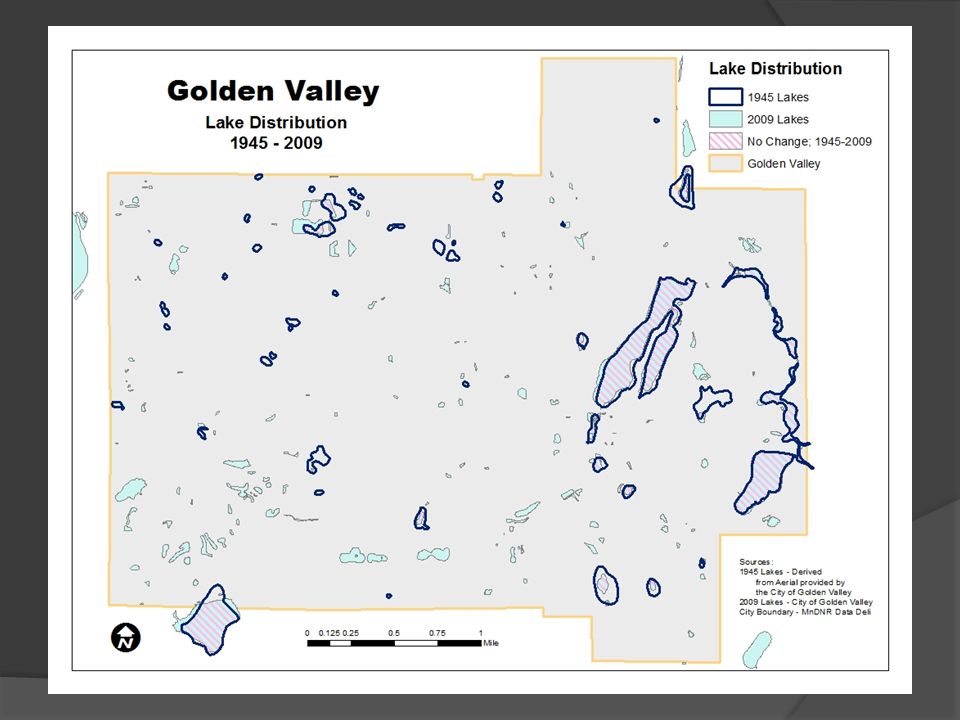
Change Detection Determined lake surface area change between 1945 and 2009 Use of Intersect and Erase tools Created 2 maps: The first map displays the distribution of the lakes in 1945 and 2009 The second map focuses more in-depth on the exact changes that have occurred throughout the years

15
Statistics 66% of the lakes that existed in 1945 are still present today 20% increase in lake area from 1945 to 2009 53% of lakes that exist today existed in 1945 Overall, there was a 58% change in lake distribution (Area of Lake Change) / (Total Lake Area Existing & Historic)
 / (Total Lake Area Existing & Historic)")
16
Findings Increase in lakes, rather than a decrease as we had assumed would be the case

17
Conclusions Digitization is the way to go with historical data

Similar presentations


, Fall ’06 Oberlin College, Oberlin OH BackgroundFindings.>")

