Download presentation
Presentation is loading. Please wait.

1
Precipitation Towers Developed by the Global Precipitation Measurement Mission Education and Communication Team NASA Goddard Space Flight Center

2
Engage What is precipitation? What do you know about precipitation? Do all places on Earth get the same amount and type? Why or why not?

3
Explore To compare precipitation for different locations, you will be making “precipitation towers” using cubes and a template, such as this example for Washington D.C.

4
Explore – Building Towers (Basic) In the middle is the name of the location and the latitude and longitude. Use the map showing the geography of the location to think about factors that influence the amount of precipitation. The data table shows the average amount of precipitation per month for this location. Stack the correct number of cubes per month (one per inch of rain) on the matching box at the top.
 on the matching box at the top..")
5
Explore - Patterns After you have placed all the cubes, look for patterns in the data and record your observations Which towers are the tallest? Which are the shortest? What does the overall pattern look like? Are the towers all about the same height? Or is there a time of year that is clearly very rainy or very dry compared to the rest of the year?

6
Explore – Building Towers (Intermediate) In the middle is the name of the location and the latitude and longitude. Use the map showing the geography of the location to think about factors that influence the amount of precipitation. The data table shows the average amount of precipitation per month for this location. Stack the correct number of cubes per month (one per inch of rain) on the matching box at the top – you will need to round to whole numbers.
 on the matching box at the top – you will need to round to whole numbers..")
7
Explore - Trends After you have placed all the cubes, look for trends in the data and record your observations Which months had the most precipitation? Which had the least What patterns do you see? Is there about the same amount of precipitation in all months, or are there times of the year that are noticeably wetter or drier?

8
Explore – Trends, cont. How much difference is there between the wettest and driest month? Calculate the range of the data. Build the precipitation towers for another location (or look at the towers of the group next to you) and compare them to the first one. Is the pattern of the data the same or different? What about the ranges of the data?
 and compare them to the first one. Is the pattern of the data the same or different. What about the ranges of the data .")
9
Explain – Discussion Questions Which location graphed seems to have the most precipitation? The least? Which locations have similar precipitation patterns? Which are very different? What additional data would you need to be able to know if these towers represent rain or snow? What other data might be useful for analyzing the weather? What can some of the impacts of having too much or too little rainfall, either for the entire year or in different seasons?

10
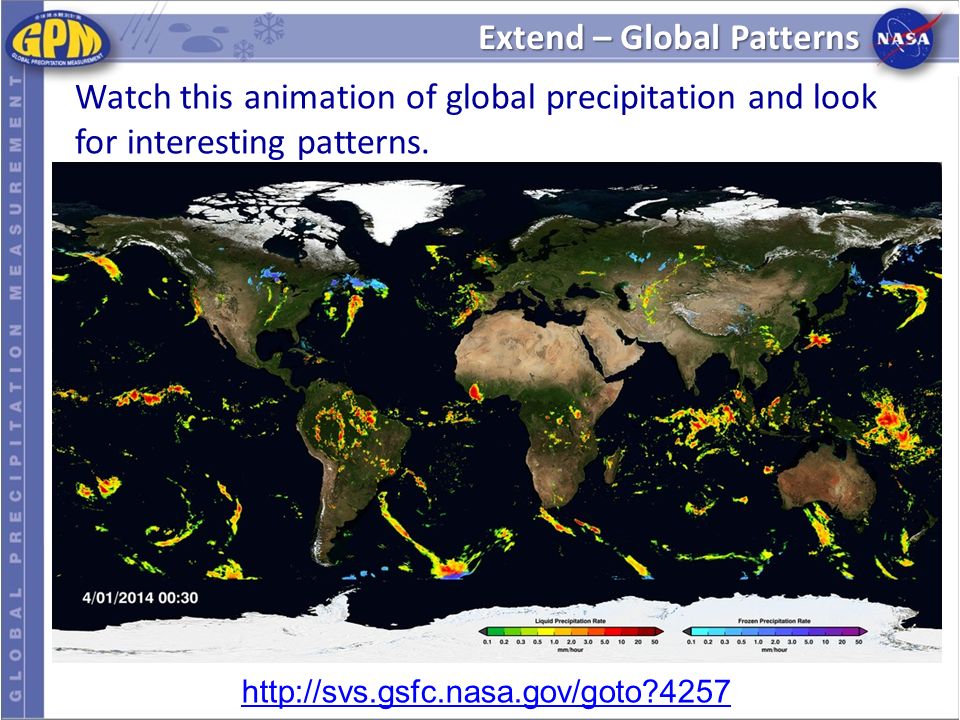
Extend – Global Patterns Watch this animation of global precipitation and look for interesting patterns. http://svs.gsfc.nasa.gov/goto?4257
11
Extend – Using the Data “Too Much, Too Little” http://go.nasa.gov/KEUfUV http://go.nasa.gov/KEUfUV “Assessing Drought in the U.S.” http://go.nasa.gov/1NiEyLO http://go.nasa.gov/1NiEyLO “Science for a Hungry World: Growing Water Problems” http://go.nasa.gov/1iBTyHy

Similar presentations


.>")


 Back to normal! Set up today’s pages 90-91 Under the IN on the top of page 90, Copy the questions below to answer during.>")


