Download presentation
Presentation is loading. Please wait.

1
Massive galaxies in massive datasets M. Bernardi (U. Penn)
")
2
Introduction –Importance of Early-Type Galaxies –The Hierarchical formation picture Down-sizing and Dry mergers Testing Dry mergers using scaling relations (Luminosities, Sizes, Velocity dispersions, Colors) Brightest Cluster Galaxies & High Galaxies Brightest Cluster Galaxies & High Galaxies Bonus Features: –Lya forest and He reionization OUTLINE
 Brightest Cluster Galaxies & High Galaxies Brightest Cluster Galaxies & High Galaxies Bonus Features: –Lya forest and He reionization OUTLINE")
3
Early-types don’t dominate number, but they do dominate stellar mass 57% 17% 43% 83% Renzini 2006

4
The most massive galaxies are red and dead

5
So they are Massive but Old We need to find out when …. stars were formed stars were formed the galaxy was assembled the galaxy was assembled

6
Old stellar population (OK for everybody!!) ?? When were galaxies assembled ?? Population of massive red galaxies seen even at z~1.5 (K20 Survey, VVDS) Still assembling at low z? In the hierarchical formation picture ….. -- prevent formation of new stars: -- prevent formation of new stars: AGN feedback / Dynamical friction AGN feedback / Dynamical friction -- assemble the stellar mass: -- assemble the stellar mass: Dry merging Dry merging
 Still assembling at low z. In the hierarchical formation picture ….. -- prevent formation of new stars: -- prevent formation of new stars: AGN feedback / Dynamical friction AGN feedback / Dynamical friction -- assemble the stellar mass: -- assemble the stellar mass: Dry merging Dry merging.")
7
Wet mergers make new stars, so bluer colors. Wet mergers make new stars, so bluer colors. Observed red colors suggest dry mergers may be necessary in hierarchical models. Observed red colors suggest dry mergers may be necessary in hierarchical models.

8
Evolution of sizes Evolution of sizes Recent work concentrates on R-L relation (difficult to measure ) At fixed stellar mass, high-z sizes are smaller by (1+z) -1 or more ( Trujillo et al. 2007; Cimatti et al. 2008; van Dokkum et al. 2008 )
.")
9
z~1.8 z~1.8 SDSS z~0.1 Cimatti et al. 2008

10
z ~ 2.3 z ~ 2.3 5 kpc @ z~0 → 0.9 kpc @ z~2.3 van Dokkum et al. 2008 Z~0

11
Increasing in size at lower z Hierarchical picture: –Dry merging – major or minor –Change in size, and mass –Changes at low z Monolithic-based model: –Super-dense galaxies are observed at the epoch when QSO are most active –AGN feedback expels gas –Sudden reduction of mass in the core makes surrounding stellar mass distribution puff up –Increases size, decreases no change in mass –No changes at z < 1

12
Fan et al. 2008 No change in galaxy size and at z < 0.8

13
Introduction –Importance of Early-Type Galaxies –The Hierarchical formation picture Down-sizing and Dry mergers Test dry mergers using scaling relations L, R, , Colors, Fundamental Plane L, R, , Colors, Fundamental Plane Brightest Cluster Galaxies Brightest Cluster Galaxies & High Galaxies High Galaxies OUTLINE

14
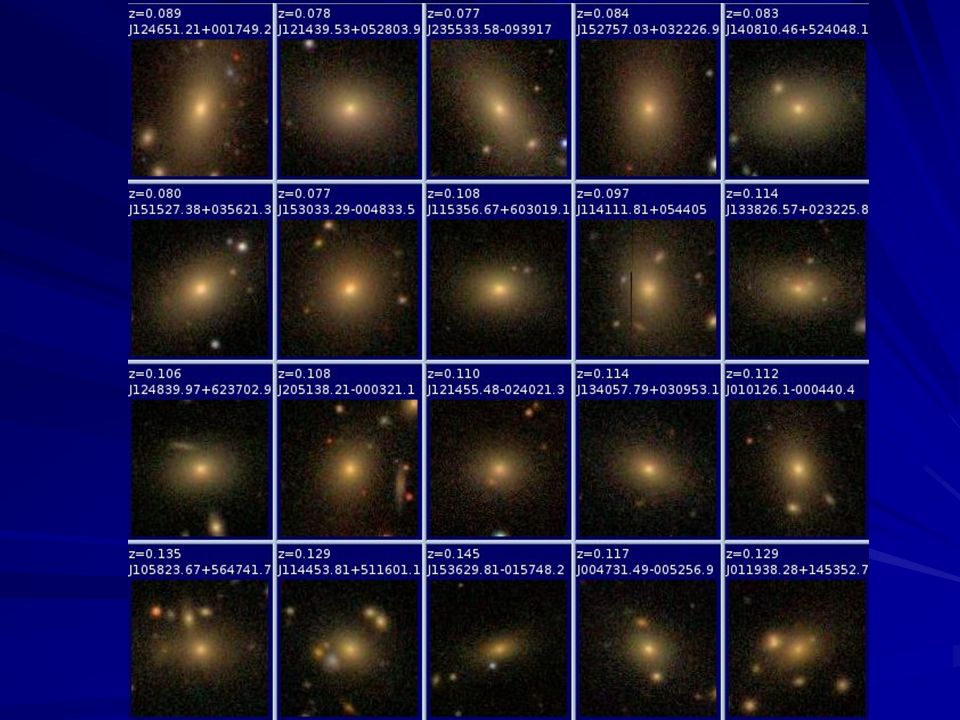
Brightest Cluster Galaxies C4 cluster catalog (Miller et al. 2005) (Miller et al. 2005)MaxBCGs (Koester et al. 2007) (Koester et al. 2007) Miller et al. 2005
 (Miller et al. 2005)MaxBCGs (Koester et al. 2007) (Koester et al. 2007) Miller et al")
16
Early-types BCGs

17
Luminosity-Size relation Upturn to larger sizes at large luminosities Why? ● BCGs ● High- Oegerle & Hoessel 1991 R ~ L 0.8 R ~ L 0.6 Dry merging? Bernardi et al. 2007 Lauer et al. 2007 Oegerle & Hoessel 1991

18
Luminosity- relation ● 2 comp ● deV Flattening at large Objects with larger M have larger size (consistent with Virial theorem) : 2 ~ M/R
 : 2 ~ M/R")
19
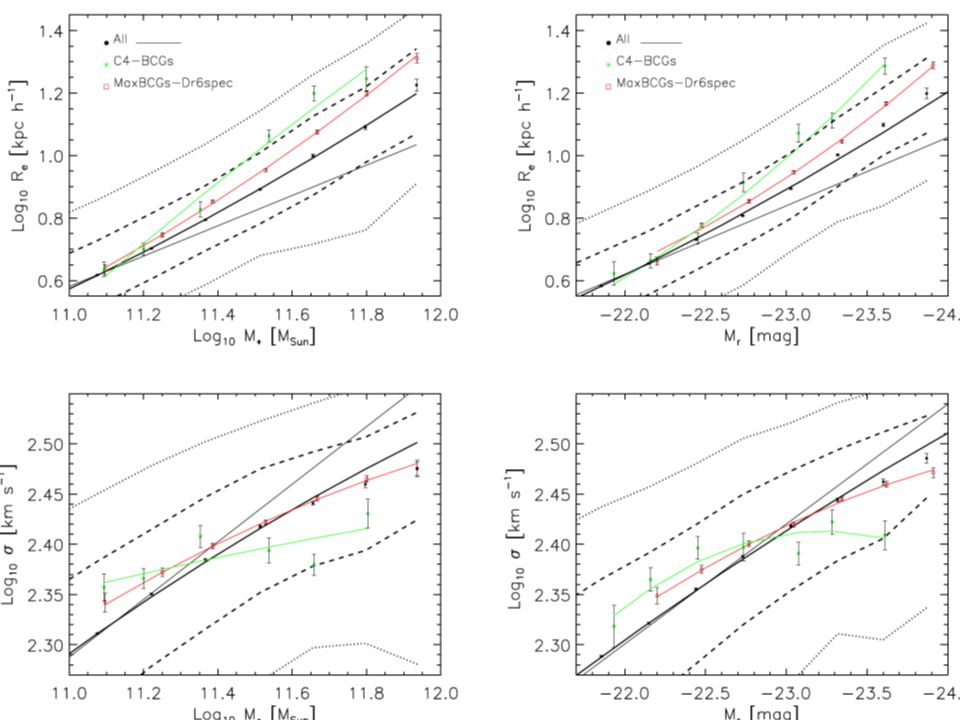
Testing dry merging at low z Bernardi 2008

22
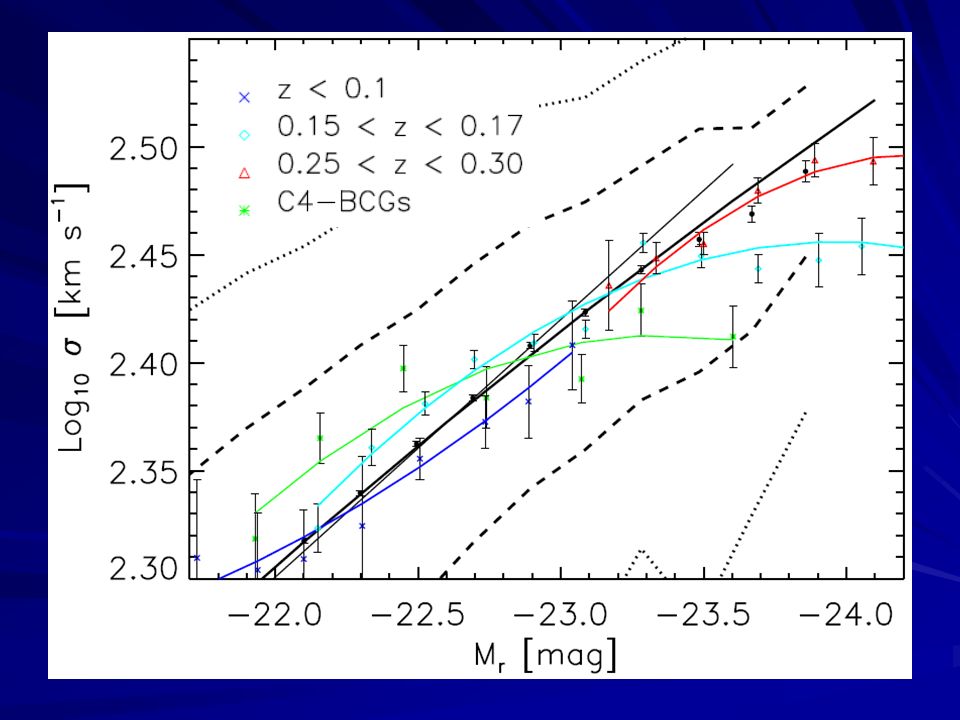
Testing evolution …. Bernardi 2008

25
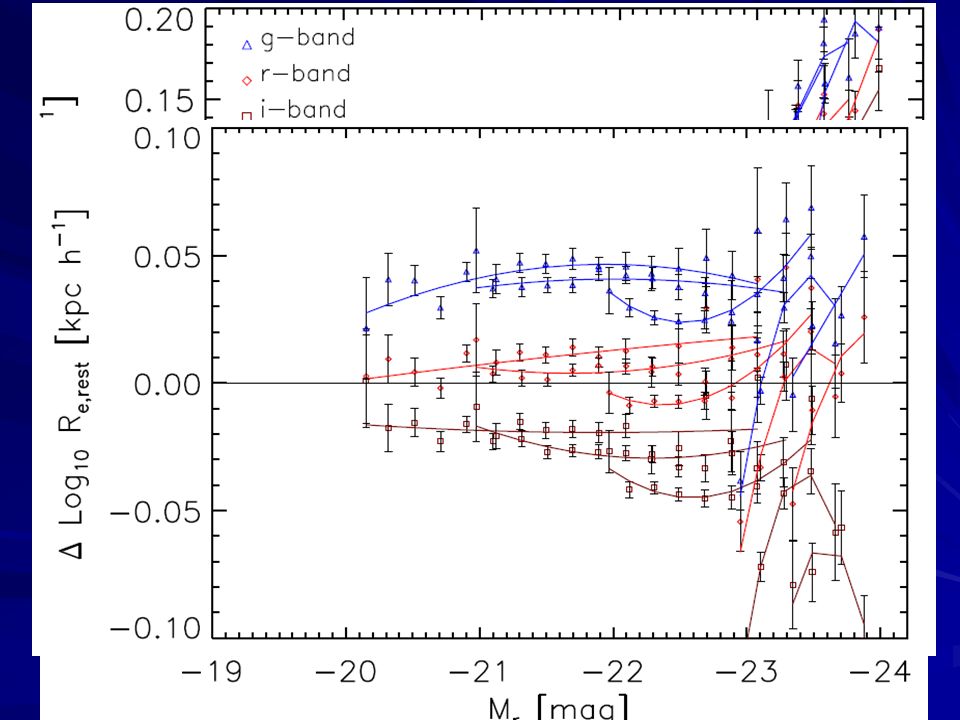
Log Re = 0.3*z (M r + 21) z~0 BCGs have R 40% larger than at z~0.3 Extrapolating: 3-4 times larger than at z ~ 2 Log = -0.1*z (M r + 21) z~0 BCGs have 15% larger than at z~0.3 Extrapolating: 1-1.5 times smaller than at z~2
 z~0 BCGs have R 40% larger than at z~0.3 Extrapolating: 3-4 times larger than at z ~ 2 Log = -0.1*z (M r + 21) z~0 BCGs have 15% larger than at z~0.3 Extrapolating: times smaller than at z~2")
26
Testing different formation times

27
At fixed stellar mass and formation time – low-z BCGs are larger – low-z BCGs have smaller At fixed stellar mass and redshift – younger BCGs are larger – no difference in

28
Testing different formation times Shankar & Bernardi 2008 Fan et al. 2008

29
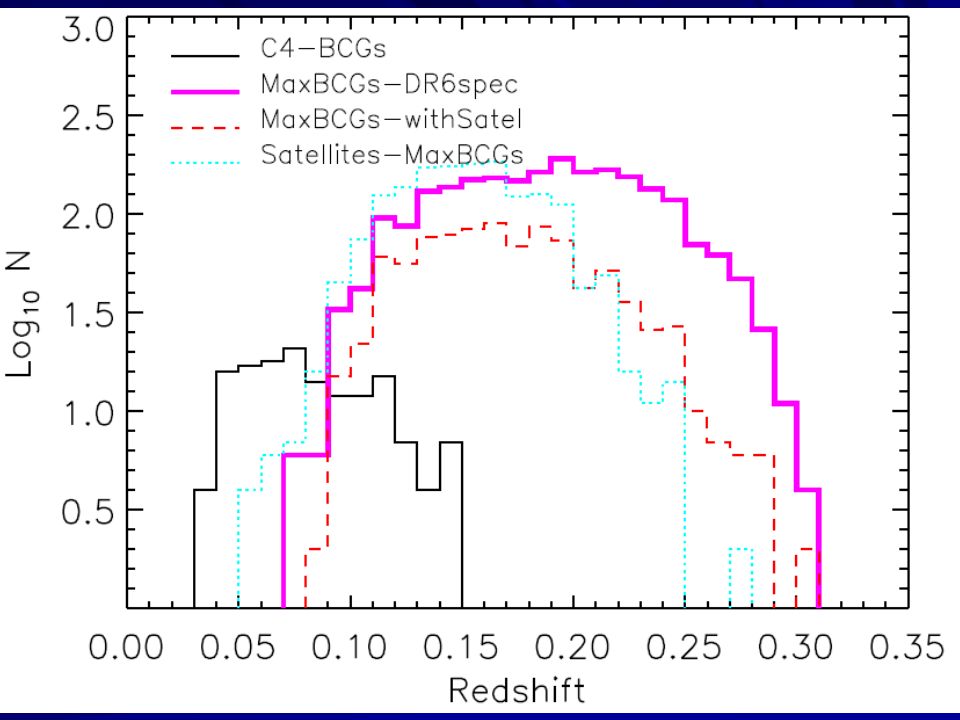
Satellites vs Central

32
Satellites have smaller sizes Bernardi 2008

33
Testing the age ….

34
Satellites ~ 0.5-1 Gyr younger

35
BCGs are less round!! Bernardi et al. 2008

36
Bimodality Models now produce reasonable color- magnitude relations Bower et al. 2006 (Durham) BCGs Satellite galaxies (not BCGs)
 BCGs Satellite galaxies (not BCGs).")
37
Bower et al. 2006 Model BCGs bluer than relation defined by bulk of red population Croton et al. 2006 BCGs

38
BCG colors not bluer ModelsSDSS Bernardi et al. 2007

39
Introduction –Importance of Early-Type Galaxies –The Hierarchical formation picture Down-sizing and Dry mergers Test dry mergers using scaling relations L, R, , Colors, Fundamental Plane L, R, , Colors, Fundamental Plane Brightest Cluster Galaxies Brightest Cluster Galaxies & High Galaxies High Galaxies OUTLINE

40
BigSigs: Another class of massive galaxies? BigSigs: Another class of massive galaxies? Search SDSS for > 350 km/s –these host the most massive BHs – constraints on formation mechanism (cooling cutoff) (cooling cutoff) Eliminate superpositions on basis of images or spectra –expect 1/300 is superposition
 (cooling cutoff) Eliminate superpositions on basis of images or spectra –expect 1/300 is superposition.")
41
Galaxies with the largest velocity dispersion ● Single/Massive Double ◊ BCG Sheth et al. 2003 Bernardi et al. 2006

42
‘Double’ from spectrum and image

43
‘Double’ from spectrum, not image

44
Aside: Identification of doubles from spectra similar to SLACS, who search for rogue emission lines in the LRG image We have already selected against emission lines – ours are superpositions of early-types, at almost the same redshift – dry mergers?

45
‘Single?’

46
HST images: with ACS-HRC SDSS = 412 ± 27 km/s SDSS J151741.7-004217.6 3” 1’ HST

47
SDSS J204712.0-054336.7 = 404 ± 32 km/s HST SDSS 1’ 3’

48
HST: ACS-HRC 23 single20 multiple = 369 ± 22 = 383 ± 27 = 385 ± 34 = 385 ± 24 = 395 ± 27 = 402 ± 35 = 404 ± 32 = 407 ± 27 = 408 ± 39 = 413 ± 35 Large not likely due to projection

49
Luminosity-size relation Luminosity-size relation Upturn to larger R at large L BCGs define steeper relation Compared to BCGs, large sample has smaller sizes Large from extreme dissipation? Bernardi et al. 2008

50
Galaxies with >350 km/s … Galaxies with >350 km/s … Bernardi et al. 2008 + cluster Δ field b/a<0.7: rotation support?

51
… are very dense … … are very dense …

52
… much denser than BCGs, … much denser than BCGs, Extreme dissipation? Projection effects? zone of avoidance

53
BCGs are less round; BigSigs are rounder!!

54
…. also redder than BCGs …. also redder than BCGs BCGs

55
Mg 2 anti-correlated with luminosity and size Similar to fast rotators in SAURON High Mg 2 caused by stars which formed from metal- enriched gas? Redder color due to high metallicity and/or dust (no to age)?
 .")
56
Hyde et al. 2008 Nuker break radius From the HST images we get more info …..

57
Red: Nuker Blue: Power law ● round ◊ elongated ● Nuker Red: Nuker Blue: Power law Hyde et al. 2008

58
About the smaller sizes at high-z z~1.8 z ~ 0.2 About the smaller sizes at high-z z~1.8 z ~ 0.2 Cimatti et al. 2008 SDSS z~0.1 Fast- rotators

59
Conclusions BCGs have larger than expected sizes, smaller than expected , and decreasing b/a with L BCGs have larger than expected sizes, smaller than expected , and decreasing b/a with L –Consistent with dry merger formation history Detected BCGs size evolution at low z -- evolution in –Consistent with dry merger formation history At fix mass, shows little dependence on t form –Consistent with dry merger formation history BigSigs – two types: –M r <-23 Prolate BCGs seen along the longer axis (core central profile) (core central profile) –M r >-23 Fast rotators – extremely dense – red color & high Mg2 (power-law central profile) (power-law central profile) -> large amount of dissipation -> large amount of dissipation -> high metallicity & dust -> high metallicity & dust Super-positions may be nice dry-merger population!
 (core central profile) –M r >-23 Fast rotators – extremely dense – red color & high Mg2 (power-law central profile) (power-law central profile) -> large amount of dissipation -> large amount of dissipation -> high metallicity & dust -> high metallicity & dust Super-positions may be nice dry-merger population!")
60
Introduction –Importance of Early-Type Galaxies Stellar masses & Black Holes –The Hierarchical formation picture Down-sizing and Dry mergers Testing Dry mergers using scaling relations (Luminosities, Sizes, Velocity dispersions, Colors) Brightest Cluster Galaxies & High Galaxies Brightest Cluster Galaxies & High Galaxies Bonus Features: –Selection bias in the M bh – L – relations OUTLINE
 Brightest Cluster Galaxies & High Galaxies Brightest Cluster Galaxies & High Galaxies Bonus Features: –Selection bias in the M bh – L – relations OUTLINE")
61
Selection bias in the M bh - L - !

62
From L From Discrepancy between M bh function from L and Tundo et al. 2007

63
What is the cause for this discrepancy? Selection bias in the -L relation!! Bernardi et al. 2007c

64
Similar bias in the K-band

65
Introduction –Importance of Early-Type Galaxies –The Hierarchical formation picture Down-sizing and Dry mergers Testing Dry mergers using scaling relations (Luminosities, Sizes, Velocity dispersions, Colors) Brightest Cluster Galaxies & High Galaxies Brightest Cluster Galaxies & High Galaxies Bonus Features: –Lya forest and He reionization OUTLINE
 Brightest Cluster Galaxies & High Galaxies Brightest Cluster Galaxies & High Galaxies Bonus Features: –Lya forest and He reionization OUTLINE")
66
Ly forest optical depth

67
Reionization of He II Bernardi et al. 2003Theuns et al. 2003 Low resolution: x SSB (1989) 42 QSOs SSG (1991) 33 QSOs □ ZL (1993) 42 QSOs ● SDSS (2002) 1061 QSOs High resolution: 10 QSOs ▲ McDonald et al. (2000) ● Schaye et al. (2000)
 42 QSOs SSG (1991) 33 QSOs □ ZL (1993) 42 QSOs ● SDSS (2002) 1061 QSOs High resolution: 10 QSOs ▲ McDonald et al. (2000) ● Schaye et al. (2000).")
68
Recently confirmed with high resolution spectra Faucher-Giguere et al. (2008)
")
69
eff eff

70
From another new set … Faucher-Giguere et al. (2008) (2003) (2009) Great project for COS
 (2003) (2009) Great project for COS")
71
THE END

Similar presentations


 Methods for deriving star formation rates UV continuum = ionizing photons (dust obscuration?) Ly = ionizing.>")


 T.Naab (USM), P. Johannson (USM), J.P. Ostriker.>")
 Austin, October 18, 2003 Facing the Future: A Festival for Frank.>")
