Download presentation
Presentation is loading. Please wait.

1
November 2009 Copyright © 2009 Mississippi Department of Education 1 Mississippi Department of Education Office of Research and Statistics Mississippi School Boards Association Fall Leadership Conference November 17, 2009 2009 State Accountability Model

2
Accountability System Accountability designation for schools and districts. Accountability system that moves the State toward national average performance. Accountability system includes an achievement component, a growth component, and a graduation/dropout component. November 2009 Copyright © 2009 Mississippi Department of Education 2

3
Achievement Measure Quality of Distribution Index QDI The Quality of Distribution Index (QDI) should be used to measure achievement. The QDI is sensitive to changes in the distribution of student performance on state assessments. The QDI measures the distribution of student performance on state assessments around the cut points for Basic, Proficient, and Advanced performance. November 2009 Copyright © 2009 Mississippi Department of Education 3

4
Quality of Distribution Scale November 2009 Copyright © 2009 Mississippi Department of Education 4 Advanced = 3 Proficient = 2 Basic = 1 Minimal = 0

5
QDI Calculation November 2009 Copyright © 2009 Mississippi Department of Education 5 Total Number of student assessments taken Total Number of students in each proficiency level Convert all numbers to percentage of each proficiency level. # Count Advanced Proficient Basic Minimal Advanced Proficient Basic Minimal 300 50 100 50 16.6% 33.3% 16.6%

6
QDI Calculation Advanced 16.6 X 3 = 49.8 Proficient 33.3 X 2 = 66.6 Basic 33.3 X 1 = 33.3 Minimal 16.6 X 0 = 0 QDI = 49.8 + 66.6 + 33.3 = 149.7 = 149 November 2009 Copyright © 2009 Mississippi Department of Education 6

8
November 2009 Copyright © 2009 Mississippi Department of Education 8 8 What is it? It is an estimate of current performance based on past performance. It is a lot like predicting whether a baseball player is ready for the major leagues based on his batting average, or whether a runner is likely to win a race based on her time at the halfway point in the race. In the case of the Growth Model, a student’s past performance on the language arts and math assessments are used to predict the student’s expected performance on assessments of language arts, math, science, or social studies. Growth Model

9
Growth Composite Growth is a measurement tool to ensure that a student receives, at a minimum, one year’s worth of learning in one year. If, based on the prediction model, the students on average in a school receive at least one year’s learning in one year, the school will have met growth. November 2009 Copyright © 2009 Mississippi Department of Education 9

10
Students in Growth Analysis Meet Full Academic Year at the district level in 2007/2008 and 2008/2009 Have MCT2 scores from 2007/2008 Have 2008/2009 scores from MCT2, Grade 8 or 9 Algebra, or Grade 9 Biology. November 2009 Copyright © 2009 Mississippi Department of Education 10

11
Copyright © 2009 Mississippi Department of Education 11 A Strategy for Meeting Growth Looking at your students and how to target their needs – by subject. Advanced High Proficient Low Proficient High Basic Low Basic Minimal Provide all students opportunity to learn Advanced High Medium Low Proficient High Medium Low Basic High Medium Low Minimal High Medium Low Or another way of looking at students November 2009

12
Copyright © 2009 Mississippi Department of Education 12 A Strategy for Meeting Growth Your Response to Intervention should support this approach! Advanced High Medium Low Proficient High Medium Low Basic High Medium Low Minimal High Medium Low Tier 1 Likely Tier 2 Likely Tier 3 November 2009

13
Copyright © 2009 Mississippi Department of Education 13 Copyright © 2009 Mississippi Department of Education 13 What does it mean about instruction? Not all students will be learning the same thing all the time. You should not see classrooms where the teacher delivers all the instruction to the class as a whole. You should see classrooms where whole group instruction, small group instruction, and even one-to-one instruction is occurring. Growth Model

14
QDI and HSCI Combined Components for Schools with Grade 12 and Districts High Performing Star High Performing Successful High Performing Successful November 2009 Copyright © 2009 Mississippi Department of Education 14 230 HSCI or 80% Graduation Rate 200 HSCI or 75% Graduation Rate

15
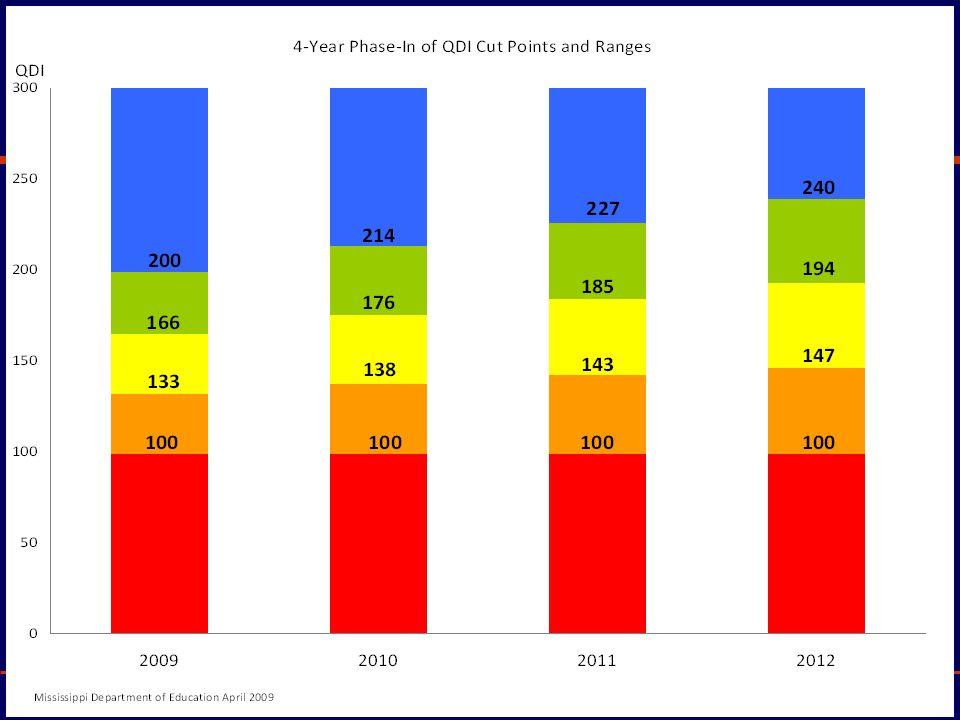
2009-2010 QDI Cut Points and Growth Assignments Chart November 2009 Copyright © 2009 Mississippi Department of Education 15 Cut Points for QDIGrowth Not MetGrowth Met 200-300High PerformingStar 166-199SuccessfulHigh Performing 133-165Academic WatchSuccessful 100-133At Risk of FailingAcademic Watch 0-99FailingLow Performing

16
Preliminary School Level Results November 2009 Copyright © 2009 Mississippi Department of Education 16 Cut Points for QDIGrowth Not Met 396 – 47% Growth Met 402 – 51.7% 200-300 43 – 5.4% High Performing 4 – 0.5% Star - 31 – 3.9% High Performing - 8 - 1% 166-199 189 – 23.75% Successful 45 – 5.65% High Performing - 131 -16.4% Successful – 13 – 1.6% 133-165 294 – 36.8% Academic Watch 139 – 17% Successful 158 – 19.8% 100-133 211 – 26.4% At Risk of Failing 156 – 19.6% Academic Watch 55 – 6.9% 0-99 61 – 7.6% Failing 55 – 6.9% Low Performing 6 – 0.8%

17
Preliminary District Level Results November 2009 Copyright © 2009 Mississippi Department of Education 17 Cut Points for QDIGrowth Not Met 85 – 56.3% Growth Met 66 – 43.7% 200-300 2 – 1.35% High Performing 4 – 0.5% Star - 2 – 1.3% High Performing - 0 - 0% 166-199 32 – 21.2% Successful 5 – 3.3% High Performing - 20 -12.6% Successful – 7 – 4.6% 133-165 54 – 35.8% Academic Watch 27 – 17.9% Successful 27 – 17.9% 100-133 55 – 36.4% At Risk of Failing 45 – 29.8% Academic Watch 10 – 6.6% 0-99 8 – 5.3% Failing 8 – 5.3% Low Performing 0 – 0.0%

18
Algebra I and Biology I Scores combined across middle/junior high school, 9 th grade school, and high school QDI based on the performance of all students in the above grades Students will contribute equally to the accountability model based on their performance November 2009 Copyright © 2009 Mississippi Department of Education 18

19
Contact Information Ken Thompson, Director Office of Research and Statistics 601-359-1878 kthompson@mde.k12.ms.us www.mde.k12.ms.us/ors Click on “Accountability Information” November 2009 Copyright © 2009 Mississippi Department of Education 19

Similar presentations


>")


 Academic Performance Index (API) SAIT Training September 27, 2007.>")


