Download presentation
Presentation is loading. Please wait.

2
LHC Collimation Working Group Monday, 21 March 2016 Analysis of collimator BPMs in the 2015 run A.Valloni, G. Valentino with input from R. Bruce, A. Mereghetti, S. Redaelli

3
Outline Fill-to-fill analysis for all collimators with embedded BPMs 16 tertiary collimators (TCTPs) and 2 secondary collimators (TCSPs) in IR6 Inter versus Intra fill stability Data analysis for proton and ion runs - Before technical shutdown 2 (electronics correction coefficients needed for calibration) - After technical shutdown 2 (calibration done online – BPM DAQ upgrade) - Combined ramp and squeeze - Ions Analysis of BPM measurements and performance during STABLE BEAM mode
 and 2 secondary collimators (TCSPs) in IR6 Inter versus Intra fill stability Data analysis for proton and ion runs - Before technical shutdown 2 (electronics correction coefficients needed for calibration) - After technical shutdown 2 (calibration done online – BPM DAQ upgrade) - Combined ramp and squeeze - Ions Analysis of BPM measurements and performance during STABLE BEAM mode")
4
Fill-to-fill analysis # of FILLSFILLSSTART DATEEND DATE Before TS2403960 - 42695/0725/08 After TS2594322 - 45576/0930/10 C. R&S64634 - 464719/1123/11 Ions234681 - 47201/1213/12 Analysis for each machine fill: Beam position relative to collimator center Correlation with nearby BPMs ~5 m away (BPMWB for TCTPs, BPMYA for TCSPs) Statistics on ‘selected fills’ (cleaning of dataset) Determination of possible ‘false triggers’ - issues with the BPMCOL class (effects of data missing for few seconds/minutes from all collimators spikes in the linear position) - issues with individual BPMs (effects of automatic gain control when the automatic gain control kicks in some spikes in the linear position are registered) - OP scenarios as VdM scans
 Statistics on ‘selected fills’ (cleaning of dataset) Determination of possible ‘false triggers’ - issues with the BPMCOL class (effects of data missing for few seconds/minutes from all collimators spikes in the linear position) - issues with individual BPMs (effects of automatic gain control when the automatic gain control kicks in some spikes in the linear position are registered) - OP scenarios as VdM scans.")
5
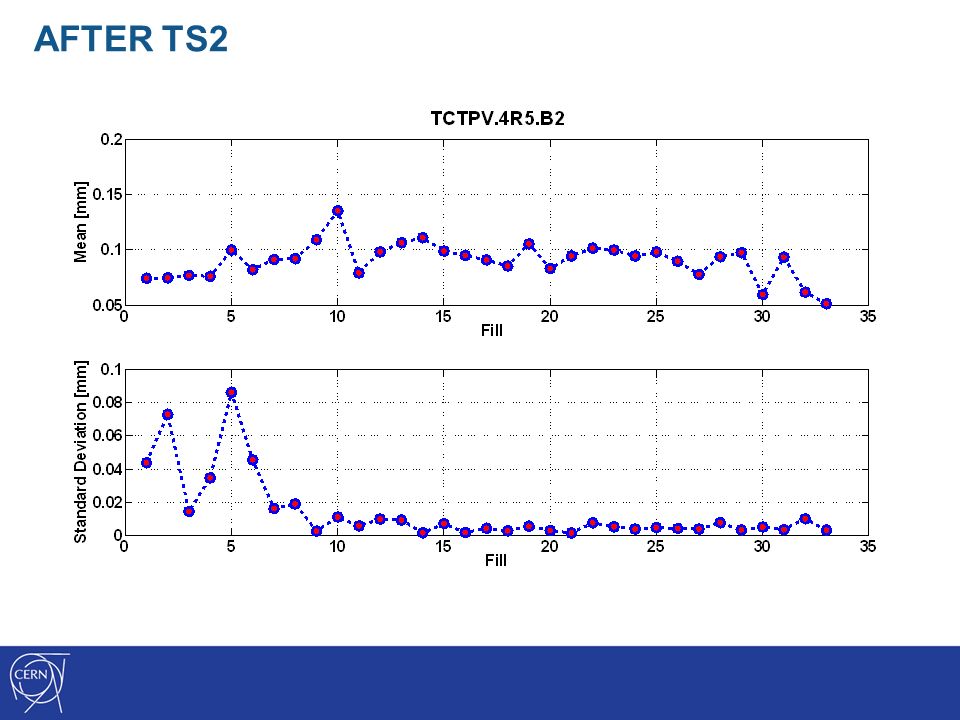
AFTER TS2 Linear Position wrt collimator center vs time per fill Good orbit stability within fill Statistics on 34 fills (out of 59) 11 fills no data or partially missing data, 5 fills 90m optics, 1 fill wrong settings, 7 fills presenting artificial spikes
 11 fills no data or partially missing data, 5 fills 90m optics, 1 fill wrong settings, 7 fills presenting artificial spikes")
6
Statistics: TCTPH.A4L1.B1 Analysis of fill-to-fill stability: Distribution of linear position (wrt coll center) calculated as the average of the upstream and downstream positions
 calculated as the average of the upstream and downstream positions")
7
Statistics: TCTPH.A4L1.B1 Inter and Intra fill stability Mean and Standard deviation calculated for 34 fills - 350 μm - 40 μm Max dispersion 0.05 23/09

8
Statistics Range of variability Max variation in the distribution of the linear position IP1: 170 um IP2: 97 um IP5: 150 um IP8: 156 um

9
Statistics Each bar represents 99% of all orbit drifts per collimator Higher spread in the TCSP.B1

10
Beam 1 Each point represents the position (averaged over each fill) of vertical vs horizontal collimators (same IP, same side) Better Inter fill stability in IP2 and IP8 ~350um ~450um (TCTPH.B1, TCTPV.B1)
 of vertical vs horizontal collimators (same IP, same side) Better Inter fill stability in IP2 and IP8 ~350um ~450um (TCTPH.B1, TCTPV.B1)")
11
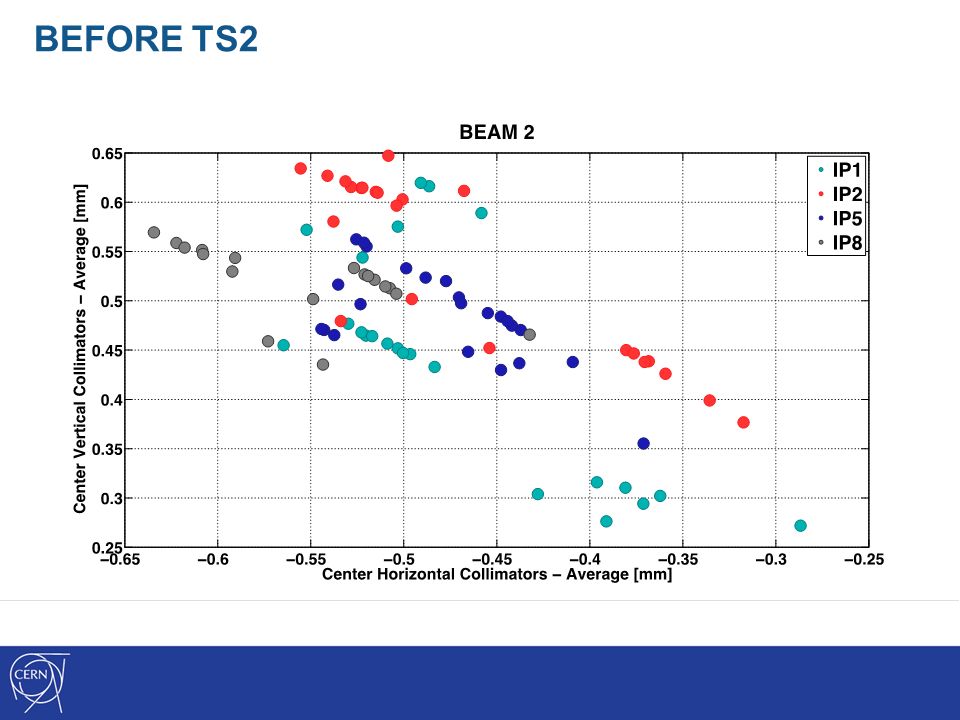
Beam 2 Each point represents the Position (averaged over each fill) of vertical vs horizontal collimators Worst inter fill stability in IP1 ~370um
 of vertical vs horizontal collimators Worst inter fill stability in IP1 ~370um")
12
Beam 1 Higher statistics: 23 fills from Before TS2 + 34 fills After TS2 Better Inter fill stability in IP2 and IP8 ~450um ~470um

13
Beam 2 Higher statistics: 23 fills from Before TS2 + 34 fills After TS2

14
Issues with the BPMCOL class ~ 220 um Missing data (6 minutes) Effects of data missing for few seconds/minutes from all collimators When data come back fake spikes in the linear position are registered
 Effects of data missing for few seconds/minutes from all collimators When data come back fake spikes in the linear position are registered")
15
Issues with individual BPM Effects of automatic gain control when the automatic gain control kicks in some spikes in the linear position are registered Spike Spikes ~200um have been observed

16
Combined Ramp & Squeeze: Settings OpticsIP1IP2IP5IP8 Step 1 0 – 200s 11-10-11-10on_x1 -170 on_sep1 -2 on_x2 -170 on_sep2 2 on_x5 170 on_sep5 2 on_x8 -170 on_sep8 -3.5 on_a8 -40 Step 2 200s – 290s 9-10-9-9on_x1 -170 on_sep1 -2 on_x2 -170 on_sep2 2 on_x5 170 on_sep5 2 on_x8 -170 on_sep8 -3.1 on_a8 -29.1 Step 3 290s – 380s 7-10-7-8on_x1 -170 on_sep1 -2 on_x2 -170 on_sep2 2 on_x5 170 on_sep5 2 on_x8 -170 on_sep8 -2.68 on_a8 -18.2 Step 4 380 – 500s 4-10-4-7on_x1 -170 on_sep1 -2 on_x2 -170 on_sep2 2 on_x5 170 on_sep5 2 on_x8 -170 on_sep8 -2.14 on_a8 -3.64 Step 5 500s – 530s 4-10-4-7on_x1 -170 on_sep1 -2 on_x2 -170 on_sep2 2 on_x5 170 on_sep5 2 on_x8 -170 on_sep8 -2 on_a8 0 6 fills at 2.51 TeV Setting changed in IP8, constant in IP1, IP2 and IP5

17
Combined Ramp & Squeeze Data are useful input for possible CR&S implementation in 2016 Comparisons between data and MAD-X simulations Positions wrt beam pipe axis Not clear what happens in IP8 ~40um

18
Ions runs Linear Position wrt collimator center vs time per fill Good orbit stability within fill Statistics on 14 fills (out of 23)
")
19
Statistics TCTPH.A4L2.B1 Analysis of fill to fill stability: distribution of linear position (wrt coll center) calculates as the average of the upstream and downstream positions
 calculates as the average of the upstream and downstream positions")
20
Statistics TCTPH.A4L2.B1 Inter and Intra fill stability Mean and Standard deviation calculated for 14 fills 280 μm 80 μm 0.011 0.002

21
VdM scans Fill 4689 VdM scans in IP1 H/V and IP5 H/V Fill 4690 VdM scans in IP2 H/V Fill 4691 VdM scans in IP8 H/V Orbit drift seen in ATLAS We would have not dumped the beam with an interlock at ~ 500um

22
Statistics Max variation in the distribution of the linear position IP1: 100 um IP2: 150 um IP5: 100 um IP8: 100 um

23
Statistics Each bar represents 99% of all orbit drifts per collimator Again Higher spread in the TCSP.B1

24
Beam 1 Each point represents the Position (averaged over each fill) of vertical vs horizontal collimators More sparse data compared to the proton runs in IP2 ~ 300um
 of vertical vs horizontal collimators More sparse data compared to the proton runs in IP2 ~ 300um")
25
Beam 2

26
Thank you for your attention Conclusions and Outlook This analysis helps understanding how low we can go with the interlocks - the inclusion of more statistics confirms the assumptions on typical interlock values which were based only on ‘some’ post-TS2 data* A limit for TCTP & TCSP interlocks of 0.4 - 0.5 mm seems reasonable (conservative limit of 1σ) Still some actions needed to overcome the issues showed with the BPMCOL class and individual BPMs - for the issue caused by the automatic gain control a flag will be set to indicate whether the data are valid or not Analysis of BPM measurements and performances for STABLE BEAM mode from July to December 2015 (protons and ions) Need to complete investigation for SQUEEZE and ADJUST modes * G. Valentino, Performance of the collimation system during 2015, Evian workshop on LHC Beam Operation

28
Backup slides

29
BEFORE TS2 Statistics on 23 fills (out of 40)
")
30
BEFORE TS2

32
Max variation in the distribution of the linear position IP1: 380 um IP2: 220 um IP5: 550 um IP8: 200 um

33
BEFORE TS2

36
AFTER TS2

39
90 m optics

40
Issues with the BPMCOL class (1/1) Effects of data missing for few seconds/minutes from all collimators When data come back fake spikes in the linear position are registered Missing data
 Effects of data missing for few seconds/minutes from all collimators When data come back fake spikes in the linear position are registered Missing data")
41
Issues with individual BPM Effects of automatic gain control when the automatic gain control kicks in some spikes in the linear position are registered

Similar presentations


 is co-funded by the European Commission within the Framework Programme 7 Capacities Specific Programme,>")


